First, we try to finalize the acceptance. The statistics of Monte-Carlo simulation to calculate the acceptance shown in the 2010 Apr 29th report was in sufficient for tp mode, and we have enlarged it 25 times here.
| Cycle | Life time (psec) | generated event No of tp decay. | PDC-PA-PB hit of p | PDC-PA hit of t | time gate (45 nsec) + selection on analysis (p only) | Successful energy loss correction (p only) | cos(tp)<-0.99 | &epsilontp(%) |
|---|---|---|---|---|---|---|---|---|
| E549 | 232 | 1.8895416E+08 | - | 740362(570127) | 642396(496060) | 637633(492297) | 499749(477632) | 2.528E-01 |
| E549 | 250 | 1.8895361E+08 | - | 738132(579689) | 640468(504627) | 635566(500762) | 506506(485865) | 2.571E-01 |
| E549 | 268 | 1.8895180E+08 | - | 733195(583838) | 636324(508026) | 631397(504089) | 508618(488939) | 2.588E-01 |
| E570 | 232 | 1.8761316E+08 | - | 541124(399588) | 469644(348116) | 465385(344930) | 351037(332833) | 1.774E-01 |
| E570 | 250 | 1.8761066E+08 | - | 539376(406423) | 468667(354368) | 464557(351215) | 356077(338855) | 1.806E-01 |
| E570 | 268 | 1.8760907E+08 | - | 533959(409987) | 463683(357008) | 459468(353735) | 357483(341367) | 1.820E-01 |
Since tritons from pt decay, with ~508MeV/c, hardly reach to PB, we are interested in to the proton-X coincidence events, for which the proton is idenitified by PA-PDC-PB-NT arm, while X stopped in PA. In order to extract pt coincidence events among them, we intend to perform particle identification only with PA information.
To avoid possible ststematic deviation of velocity by hypernuclear lifetime, we examine PA-PA TOF analysis for Larm-Rarm charged coincidence events. When the particles can reach PB, particle identification is feasible, and hence we can check 1/&beta VS dE/dx correlation for proton and deuteron events helped by those events in which p and p or p and d reached PB simultaneously. Below, we show the correlation between PA-PA 1/&beta VS dE/dx on PA for the events in which a proton was detected by counter PA-PDC-PB-NT arm.
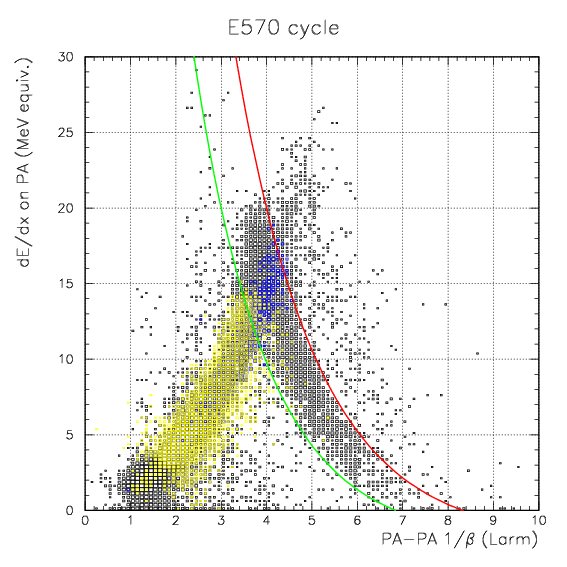
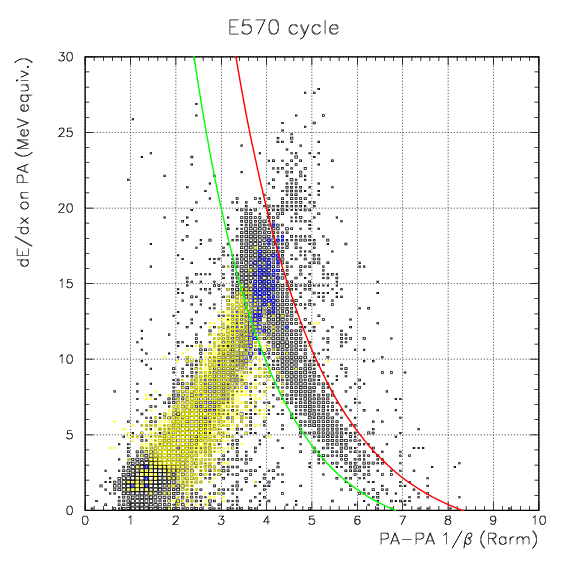
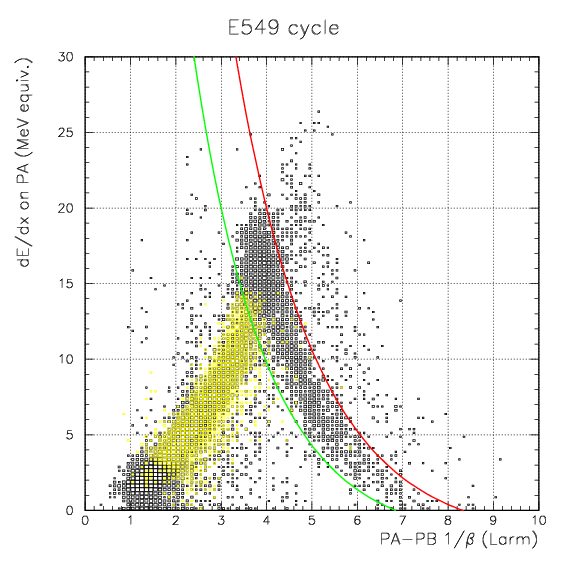
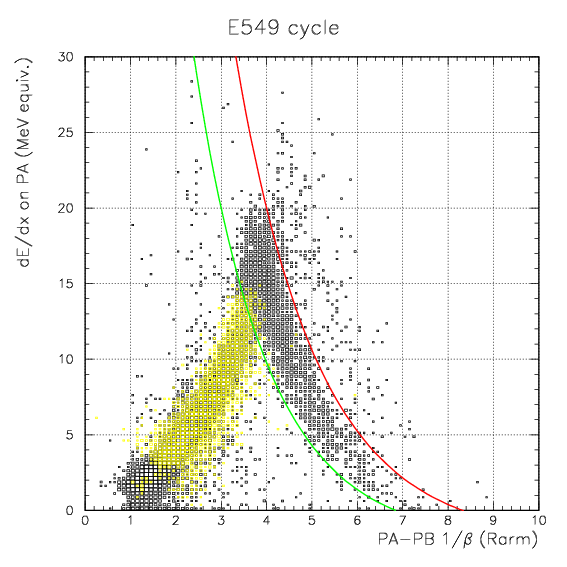
We have defined phenomenologically the border of triton-like events and others. The aggressive border to eliminate stopped deuteron events (red curve) is given as
dE/dx = 22.0×exp{-(β-1-4.0)/1.8} -2.0,
and the conservative one isdE/dx = 22.0×exp{-(β-1-3.0)/1.6} -2.0,
by which stopped deuteron events are also involved in the triton-like events. Adopting these two selections, we examine proton spectrum under triton coincidence condition.(4He-K-)atomic -> Λ + t,
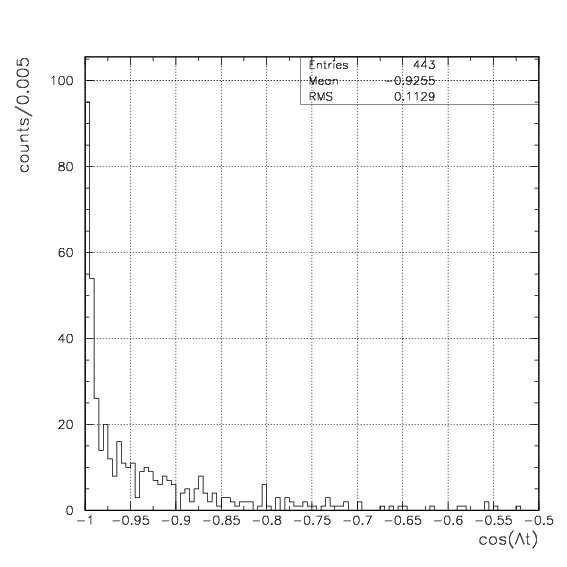
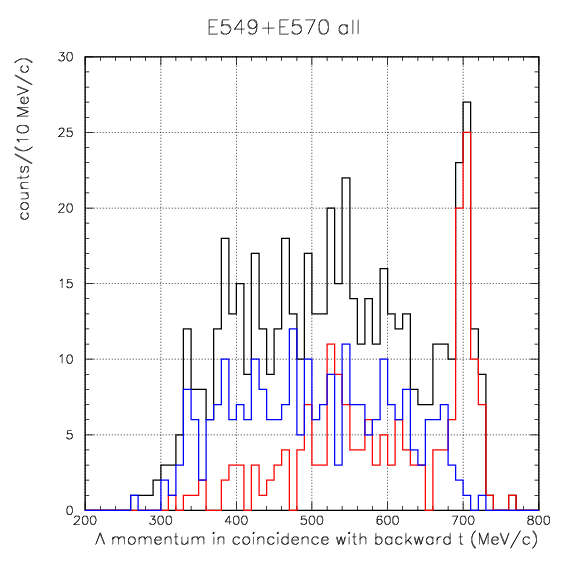
at &Lambda momentum of ~712 MeV/c. The four-nucleon process is known to have the branching ratio, 3±2×10⁻⁴ (R. Roosen and J. H. Wickens, Nuovo Cimento 66 101 (1981).), under the assumption that all 3 events are rightly from the reaction, not from the Λdn final state. First, we show p-π invariant mass spectrum under p+&pi + t coincidence condition below. By classifying with the consistency between the direction of the 3-momentum and deviation of decay vertex and incident kaon track, we observe Λ particle succsessfully with nice S/N ratio for the triple coincidence events. Then, the opening angle between idenfified &Lambda and triton is studied. The back-to-back correlation is strong, and the event is clastering to cos(Λt)<-0.98.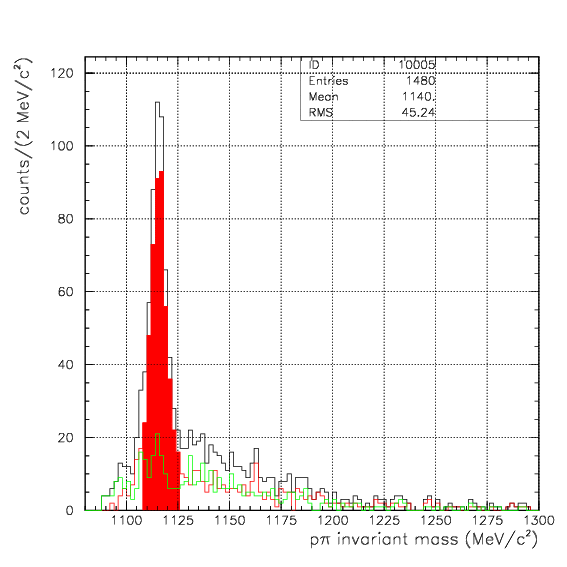
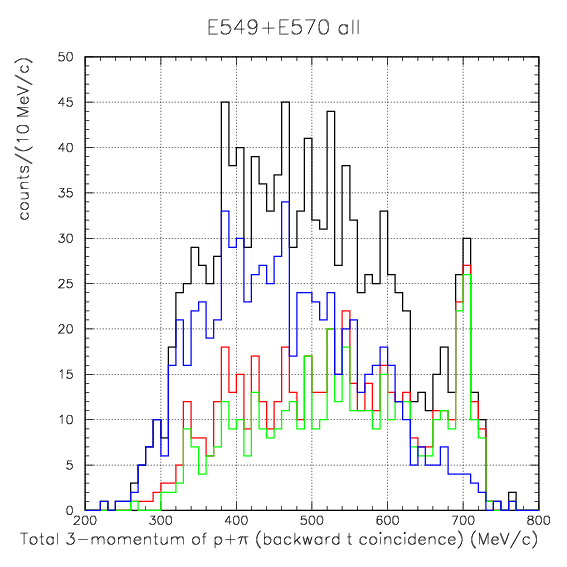
Lastly, we show the &Lambda momentum spectrum and its classification. We observe a monochromatic strong peak at around ~700 MeV/c, and this peak structure appears only if the p-&pi is from real Λ decay, and only if cos(Λt)<-0.98 . Therefore, this peak is attributed to the four-nucleon process, (4He-K-)atomic -> Λ + t. The event selection defined above to exclude stopped deuteron confidently involves stopped triton, and hence we adopt is also for the upper limit study of pt decay mode of 4&LambdaHe.
1. Constructing the proton spectrum in coincidence with t with cos(tp)<-0.99, to which the detection efficiency had been evaluated by Monte-Carlo calculation.
2. Fit a Gaussian and a BG function to the proton spectrum, and deduce the possible upper limit of the Gaussian area. The upper limit gives the count-number-basis upper limit.
As the first step, we show the distribution of cos(tp) and proton momentum below.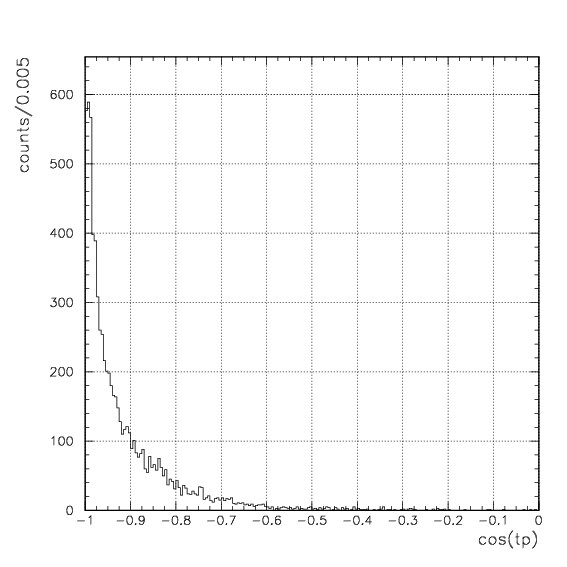
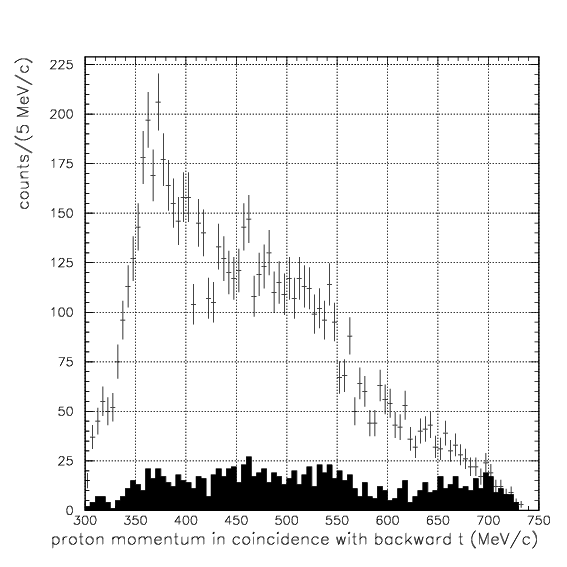
To start the fitting, we do need some consideration on
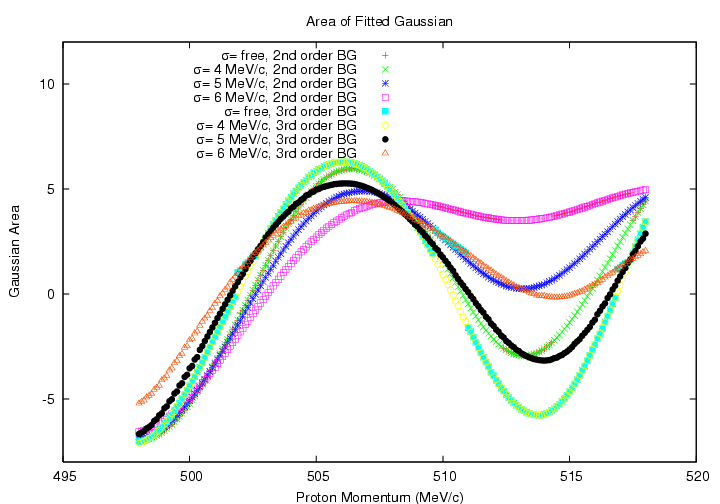
The best-fit values of Gaussian area are given below as the functions of the measured proton momentum. It commonly takes a maximum of ~6 at around 505 MeV/c, and it takes negative values in a certain momentum region depending on the setting of the procedure. The value, 6, corresponds to the branching fraction of (1.6±0.2(syst)) × 10-5.
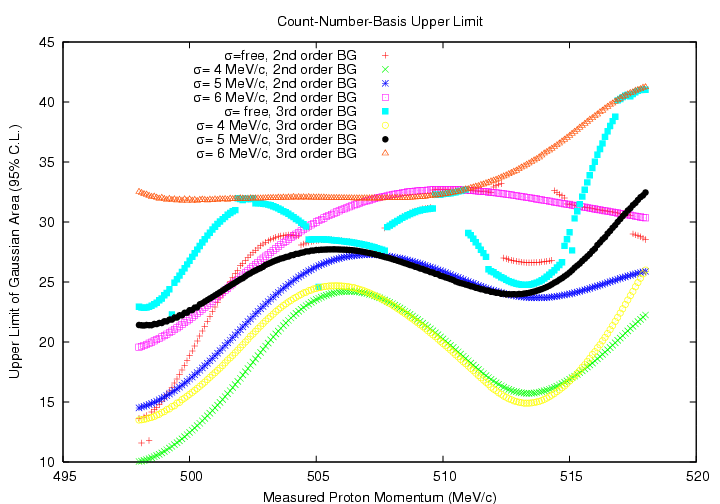
The count-number-basis upper limit is given below, as the functions of measured proton momentum. If we take the maximum values of the 8 curves in the momentum region (498.4, 513.4), we obtain 34.9 counts as the 95% C.L. upper limit for σ=6 MeV/c at 513.4 MeV/c. The 95% C. L. upper limit, CU.L. is defined by
CU.L. = S + 1.96Sσ,
where S is the best-fitted area, and the S&sigma is attributed 1-standard-deviation statistical error of S. Substituting the CU.L. to the equation to get the percent-per-stopped-K- upper limit, we obtainBr((4He+K-)atomic -> π- + 4&LambdaHe ; 4&LambdaHe -> t+p)U.L. = 1.1 × 10⁻⁴,
where systematic error of 14% is considered by multiplying the factor 1.14 to the calculated upper limit by using the central value of the scaling factor.