Last updated : 26/Jan/2006
[Back]
The summary of the fits of corrected histograms (these fiugres).
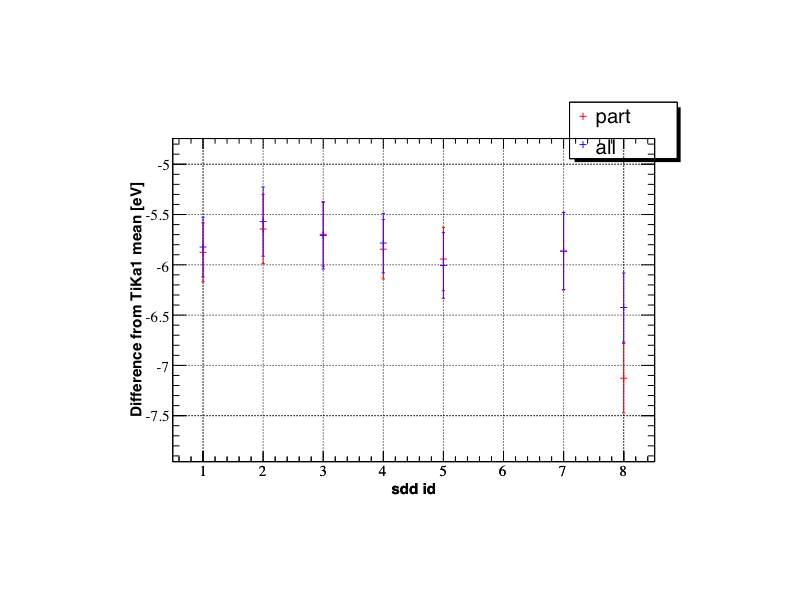
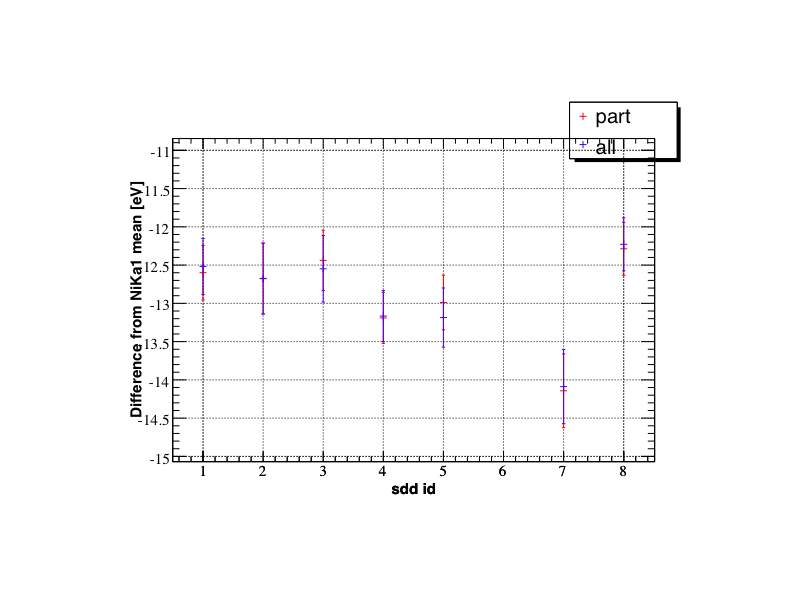
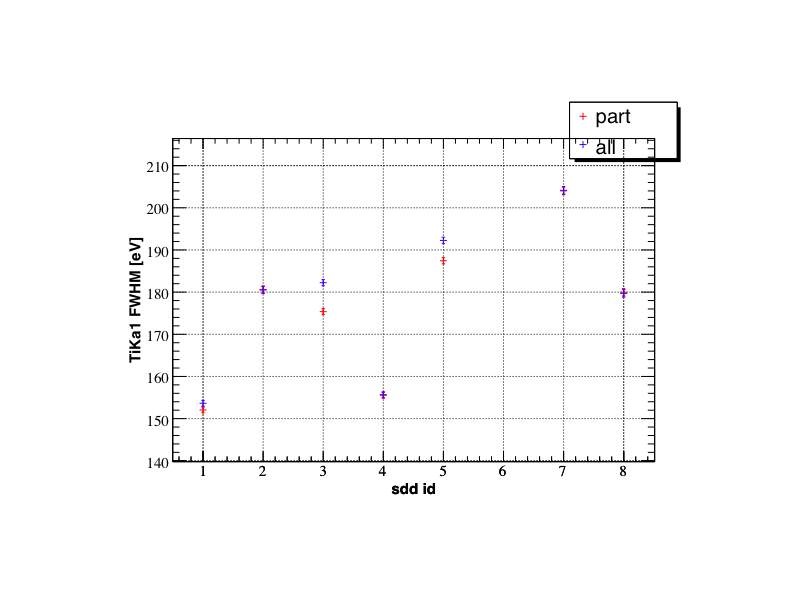
&ldquo all &rdquo means the correction by the fit value of all summed up histograms (red line of ev2ch figures).
&ldquo part &rdquo means the run part by run part correction.
The mean of Ti Ka1 is about 6 eV smaller than the referential value 4510.84 eV (Figure 1). Also Ni Ka1 mean is about 13 eV smaller than the referential value 7478.15 eV (Figure 2). These shifts are systematic, now I have no idea to explain them... (a bug was found and fixed &rarr new result)
The FWHM of Ti Ka1 are shown on Figure 3. We can see SDD3 and SDD5's FWHM are improved by run part by run part correction. But others have no difference.


