Here, we check how the new PA-PB TOF analysis works.
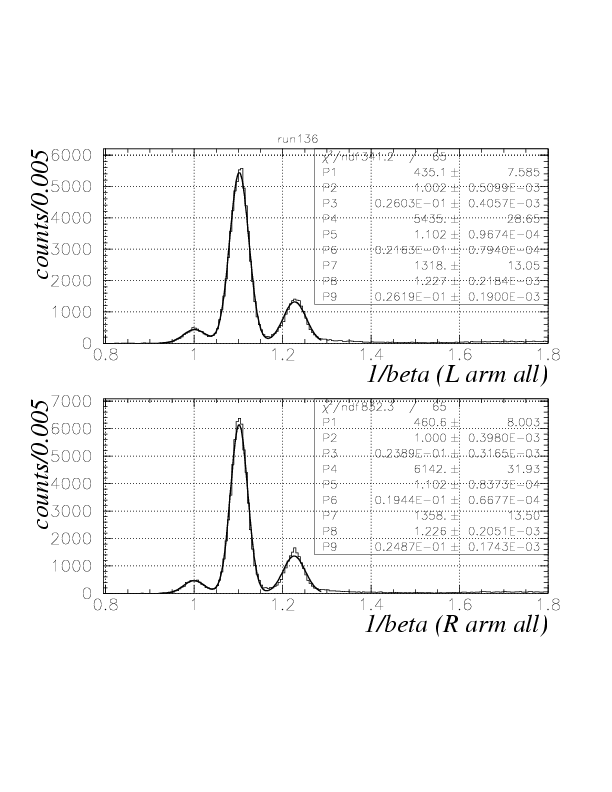
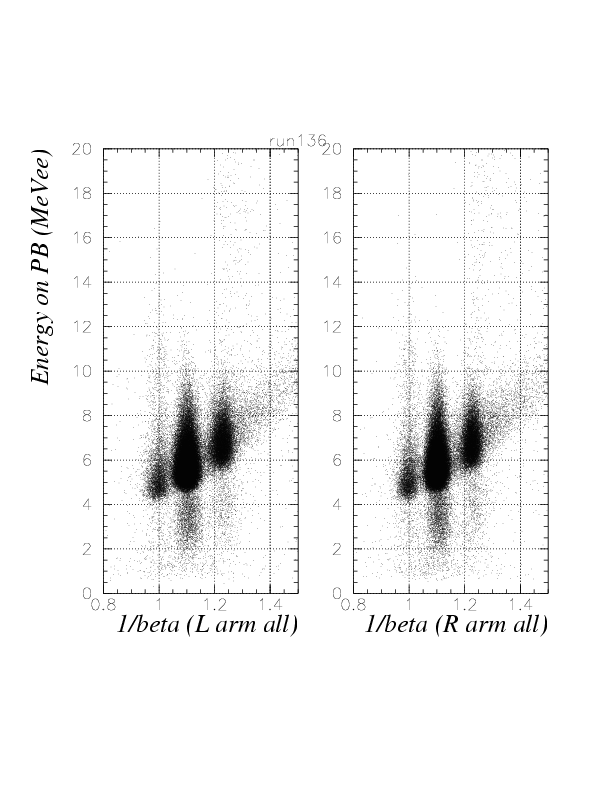
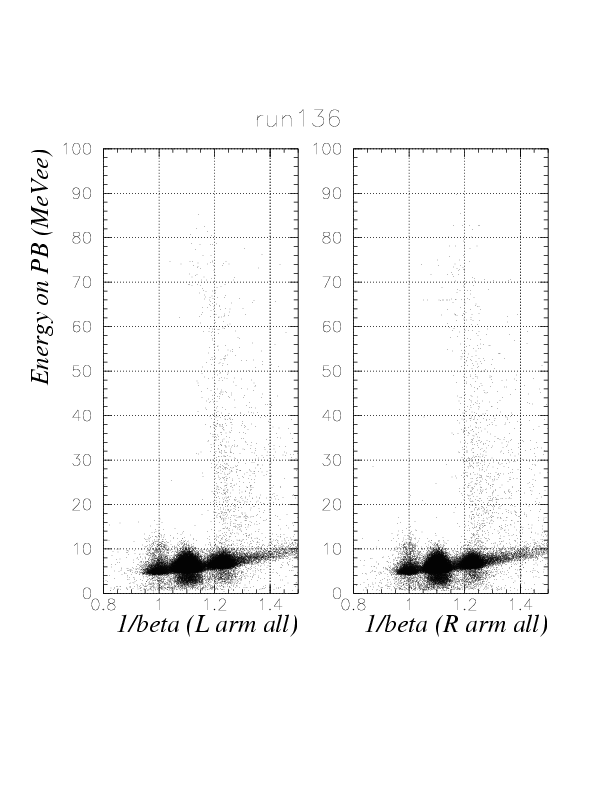
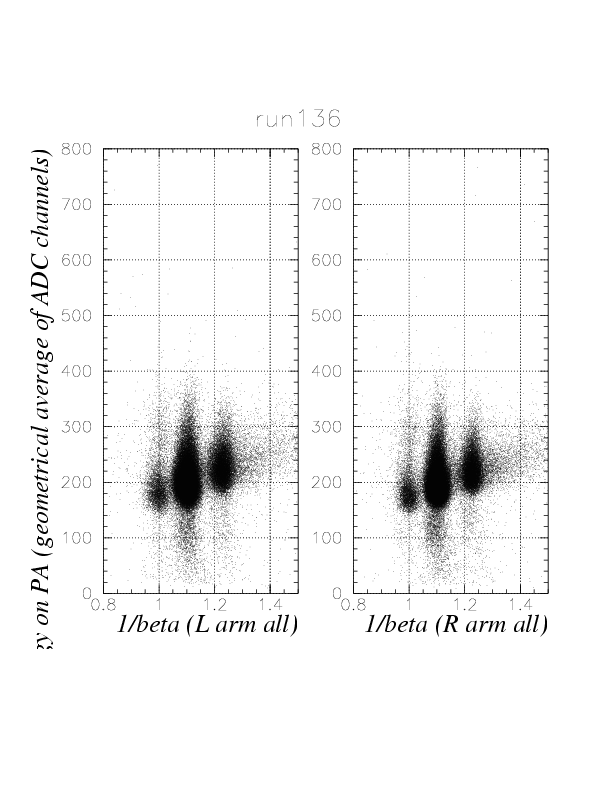
Arm-by-arm 1/beta spectra and correlations between 1/beta and PA/PB-detected ADC pulse heights.
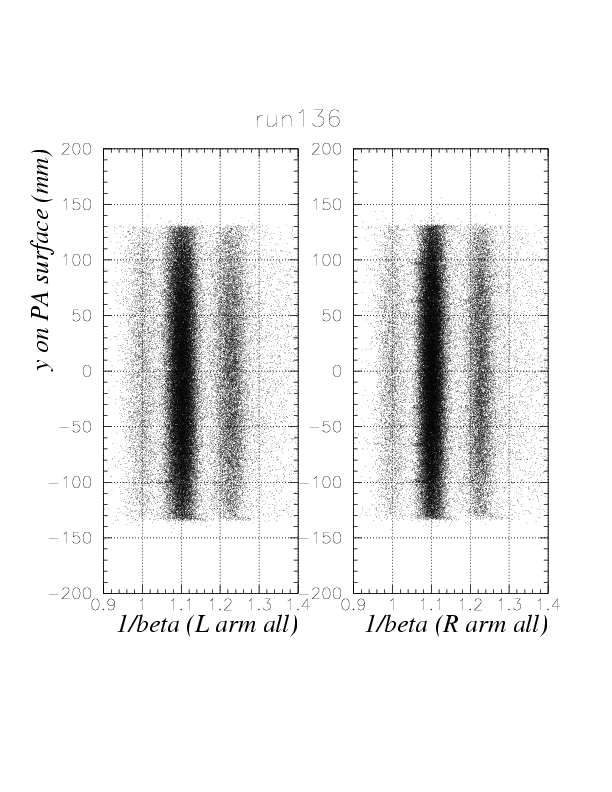
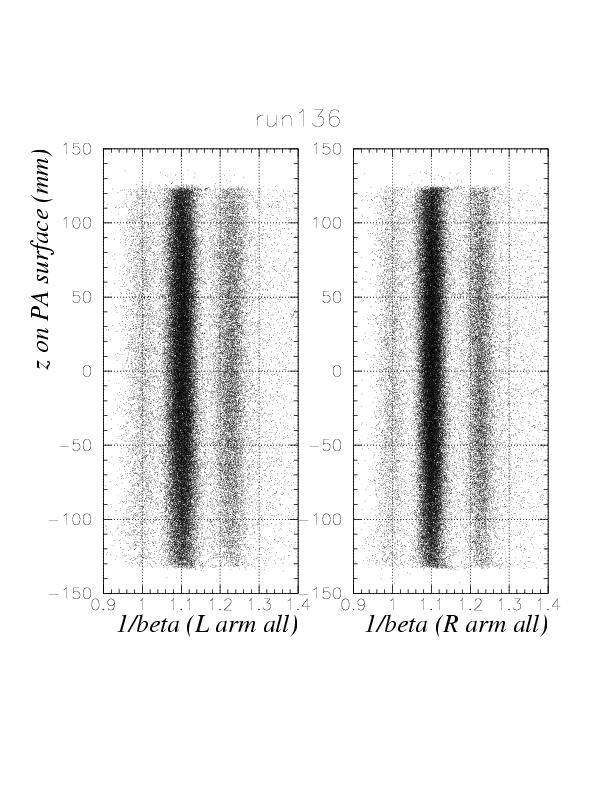
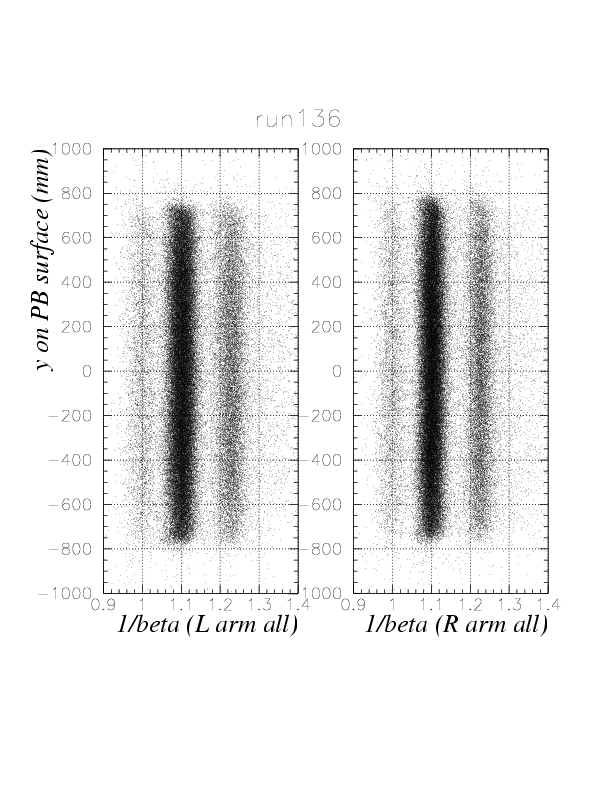
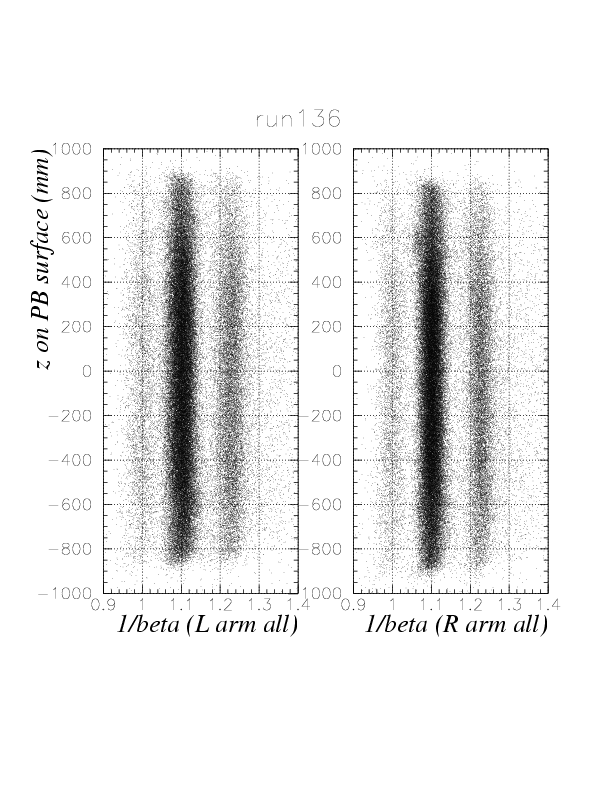
Correlations between 1/beta and y/z positions on PA and PB for e/mu/pi peaks.
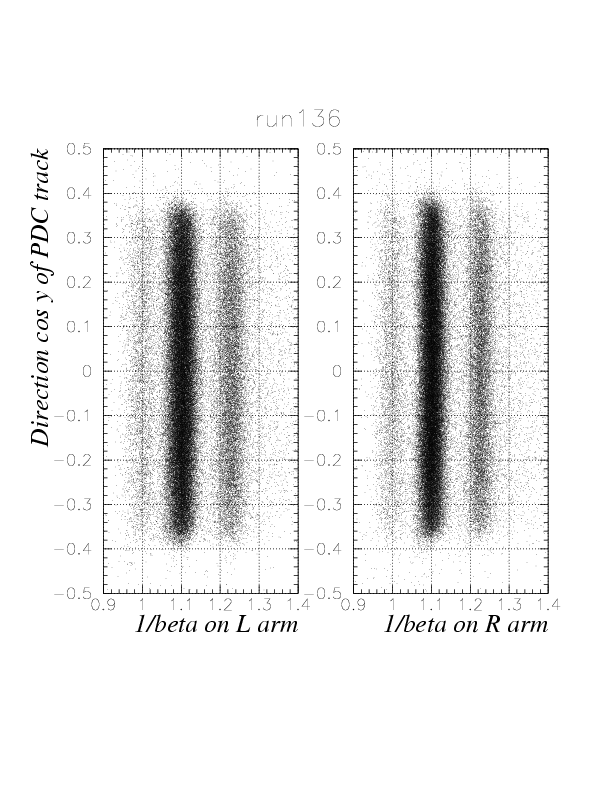
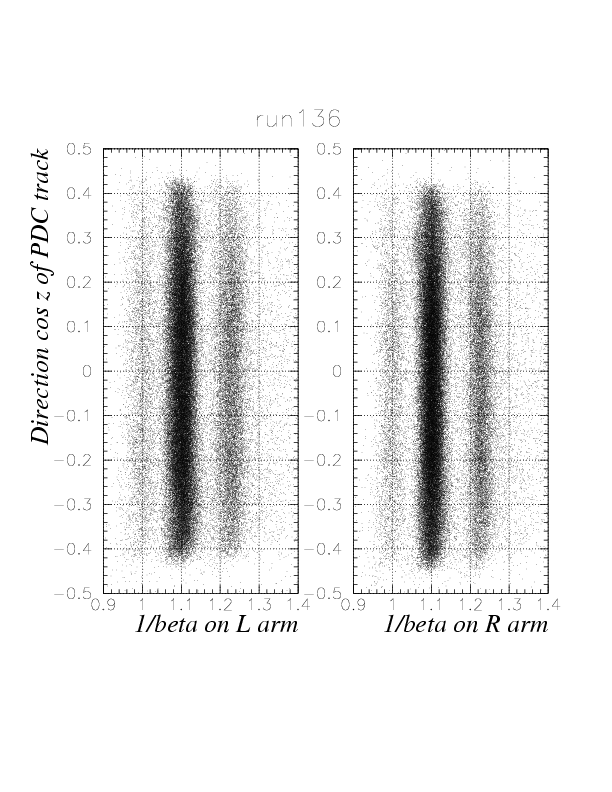
Correlations between 1/beta and y/z direction cos detected by PDC for e/mu/pi peaks.
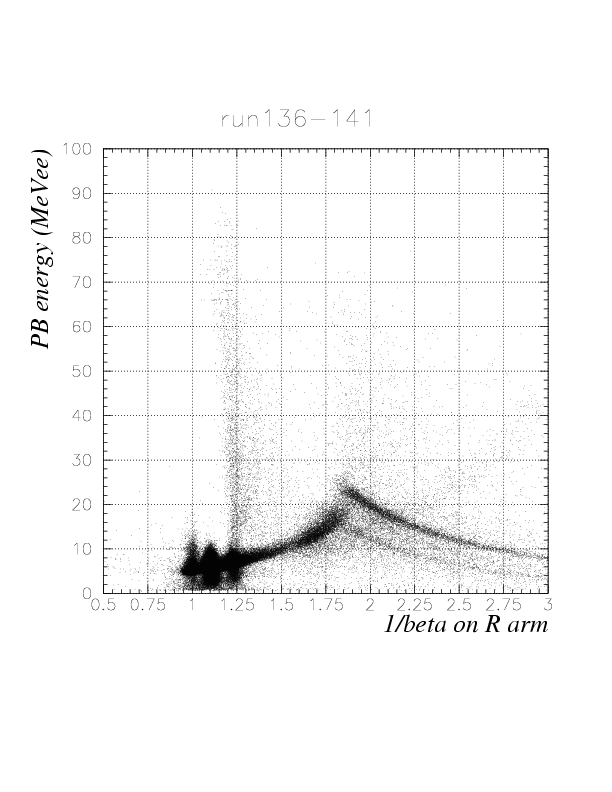
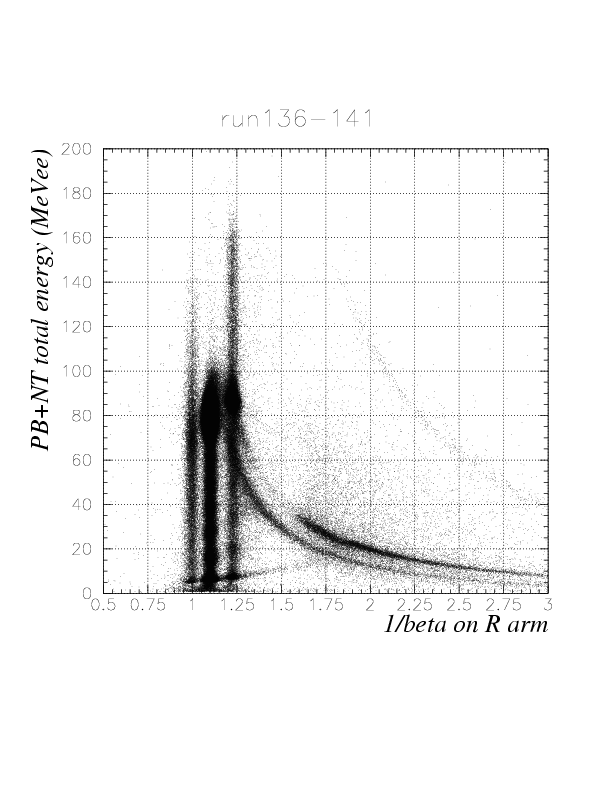
Correlations between 1/beta Energy on PB/Total energy (PB+NT).
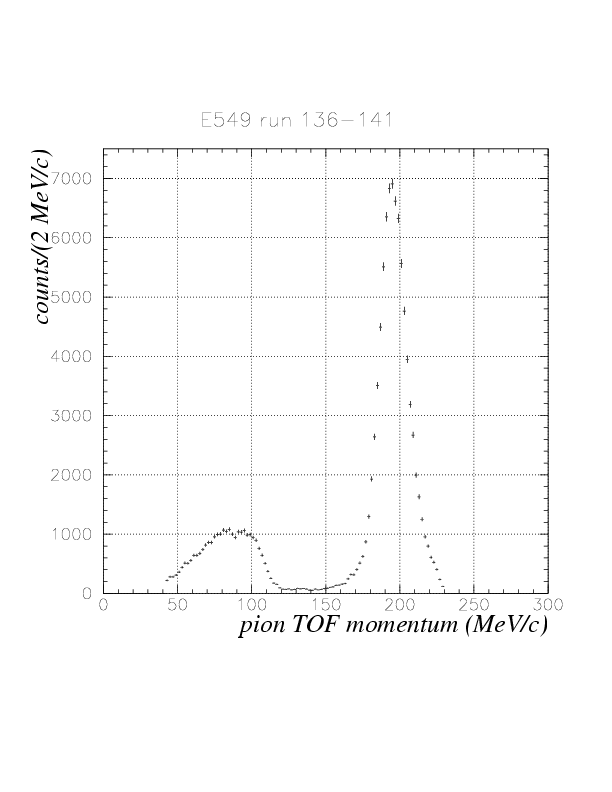
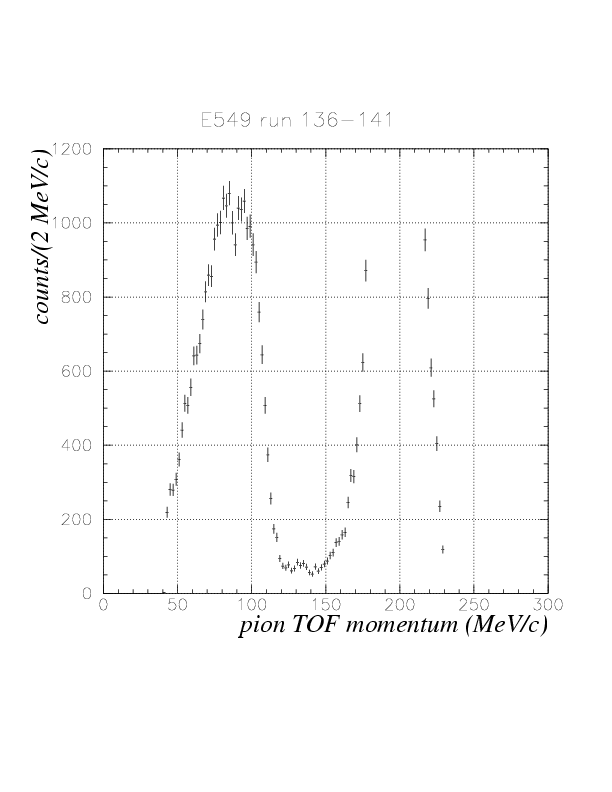
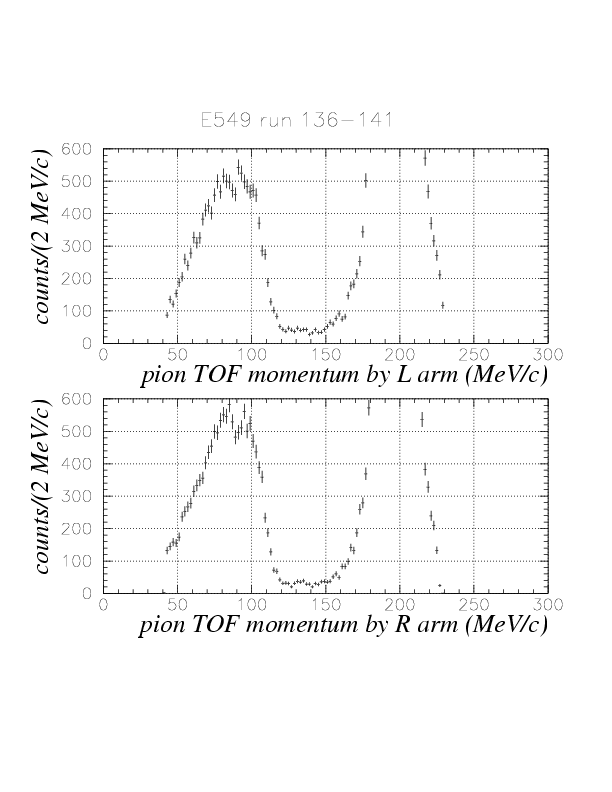
PA-PB TOF momentum spectra from (stopped K^+,pi) decay. All TOF parameters are adopted from mu^+ result without any modification. Note that 4He events and stopped events are properly selected by means of vertex z VS T0 energy, and z and y hit positions on PB are limitted to be -500 ~ + 500 mm, to avoid possible additional bump structure due to PID.
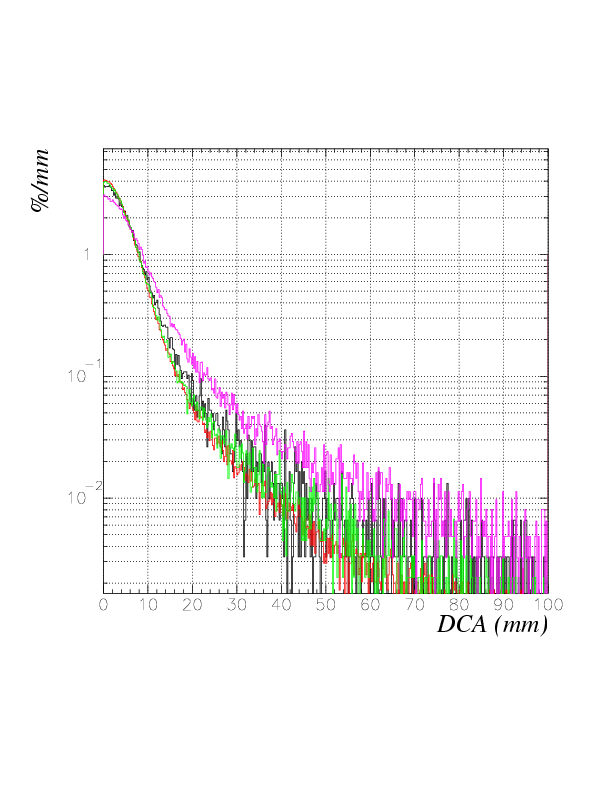
DCA distribution for e(0.96 < 1/beta <1.04, black ), mu (1.06< 1/beta < 1.14 red) and pi (1.185 < 1/beta < 1.265 green) and slow pi (1/beta > 1.3, magenta). The DCA is extremely narrow for Kmu2 events, while relatively broad for 3-body decay-products.