Normalization of the process and acceptance study
Now, we are interested in to estimate exactly the acceptance of a cascade reaction of a branch of four-nucleon absorption process,
(4He-K-)atomic -> Λ+t (711.7 MeV/c) ,
and successive weak decay of Λ,
Λ -> p + π-.
The exact normalization is performed by

, where
P- : Free-decay rate of atomic K- by meta-stable states, 3.5 +- 0.5 %.
Br(K- -> μ&nu) : Branching ratio to Kμ2 decay, 63.55 %.
&epsilon-&mu : Physical acceptance of &mu-, 7.55 %.
&epsilon-delay : Muon survivability by delayed timing gate 1.2 nsec, 89.1%.
&Sigmacycles C- : Total number of observed monochromatic peak counts on the Λ momentum spectrum: 73.6 ± 8.6
N-Kμ2 : cycle-by-cycle value of detected &mu- number under the condition, Tdelay > 1.2 nsec. 111561/111704/44124 for E549/E570-1/E570-2.
&epsilon-Λt : cycle-by-cycle value of physical acceptance of the (4He+K-)atomic->Λ+t reaction, to be finalized here.
In order to estimate physical acceptance &epsilon-Λt defined as,
Ndetected = Nproduced*&epsilon-Λt,
we perform a Monte-Carlo simulation of the cascade reaction, and conditions of the simulation are as tabulatted below. The physical acceptance includes
Geometrical acceptance by PA-PDC-PB-NT (proton),
Geometrical acceptance by PA-PDC (triton),
Geometrical accpetance by TC-VDC (&pi-),
Branching ratio of Λ->p+π- decay,
In-flight reaction (proton/π-),
Analysis efficiency of proton selection by 1/&beta VS total energy at PB + NT (proton),
Efficiency of energy loss correction (p and π-),
PA-PB timing gate, 45 nsec by E549/E570 electronics (proton),
and
Efficiency of the opening-angle selection, cos(Λt)<-0.99, for reconstructed 3-momentum of Λ smeared by multiple-scattering and TOF resolution for p and &pi- on correspondig arms.
The condition of the Monte-Carlo for the acceptance calculation is tabulatted below:
Conditions of the Monte-Carlo.
| software | GEANT3.21(partice tracking tuned for slow particles) |
| Reaction | (K--4He)atomic -> Y0+t |
| Branching ratio | 50% (Y0 : Λ)/ 50% (Y0 : Σ0) |
| (K--4He)atomic life time | 6.6*10-17 sec (Γ=10 eV) |
| Generated number of (K--4He)atomic | 2*107 |
| Target center (cm) | (x,y,z)=(-0.3,0.,1.3):E549 / (-0.5,0.5,1.2):E570 |
| x/y generation point distribution | 4.0 cm &sigma Gaussian centered at (x,y)=(-0.3,0.) |
| z generation point distribution | uniform |
| Multiple scattering | on(Moliere) |
| Energy loss straggling | on(Gauss/Landau/Vavilov are internally selected adequately) |
| In-flight nuclear reaction of p/t/π- | on(GHEISHA, unique selection for in-flight reaction loss for d) |
| Coincidense time gate for PA-PB | 45 nsec |
| Birk's coefficients | 0.013/(MeV/cm), 9.6E-06/(MeV/cm)2 for PA/PB/NT/TC |
| Time resolution of PA/PB | 60/90 psec (~108.2 psec in total), fixed at MIP-measured value. |
| TOF resolution of &pi- by PA-TC | 250 psec. |
| Proton selection | Simulated with 1/&beta VS total Light output (with infinite energy resolution). |
| PDC/VDC hit | Only 1 particle is accepted per chamber. Multi track events (p+&pi-,etc) are eliminated. |
| Inefficiency of energy loss correction | Considered to p and π-. As the decay vertex, exact position is adopted. The direction vector at the PDC/VDC position is adopted as the direction vector to simulate properly the experimental effect. |
Distributions of some quantities
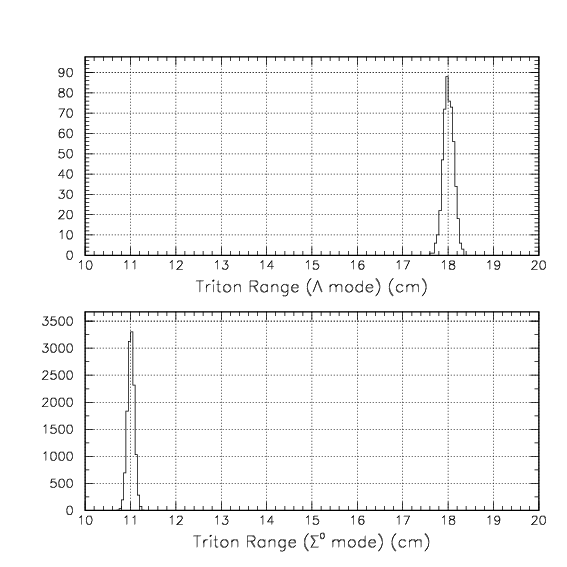
Since we are not very familiar to the 4NA process, we first try to simulate vrious quantities, to check the properties of the processes. In these processes, the range is so long compared to the tritons from 4ΛHe -> tp decay, and hence a substatntial fraction is expected to reach the PB counter. Therefore, the triton selection introduced previously to select 508.4 MeV/c triton from 4&LambdaHe -> tp decay is too narrow for these 4NA processes, and we do need to care additionally energetic part which is out of the present selection. The selection is performed by PAPB-measured 1/β VS energy deposit on PB, as was done for proton/deuteron.
Simulated range distributions for both modes. They peak at ~18 (Λt) and ~11 (&Sigma0t) cm, respectively.
Simulated correlation of 1/β VS total energy deposit on PA, for Λt and &Sigma0t modes, respectively. The red events are those which reached PB.
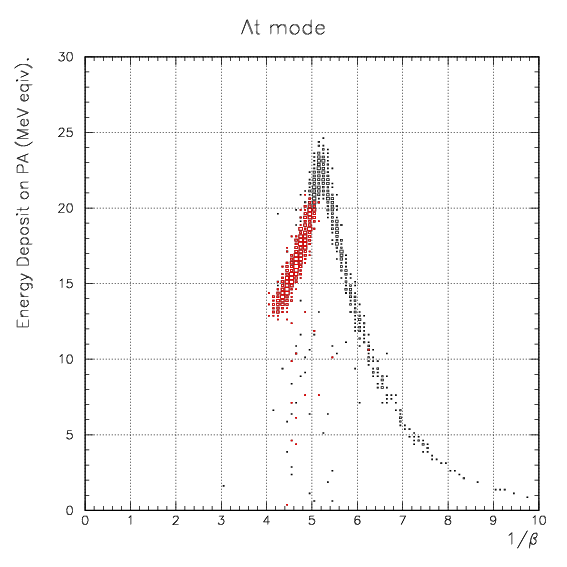
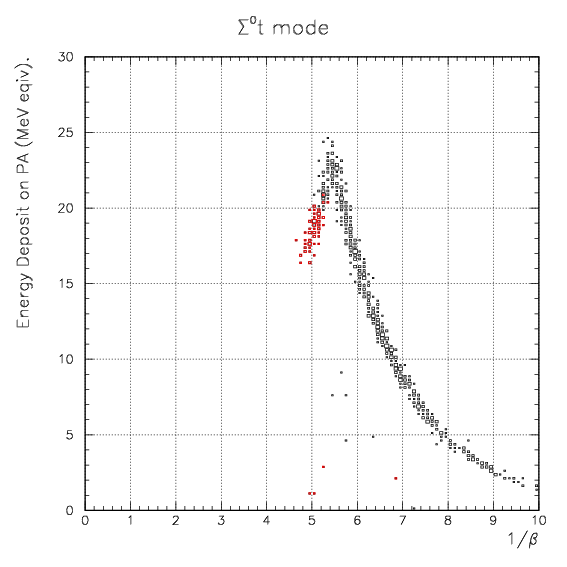
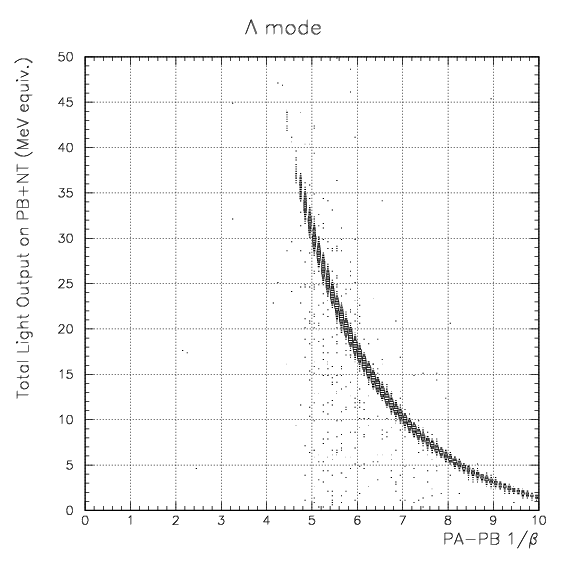
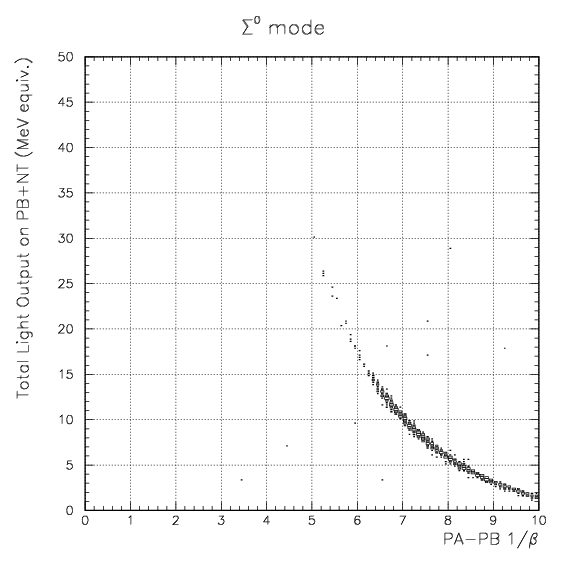
Simulated correlation of PAPB-measured 1/β VS total energy deposit on PB+NT, for Λt and &Sigma0t modes, respectively. The red events are those which reached PB.
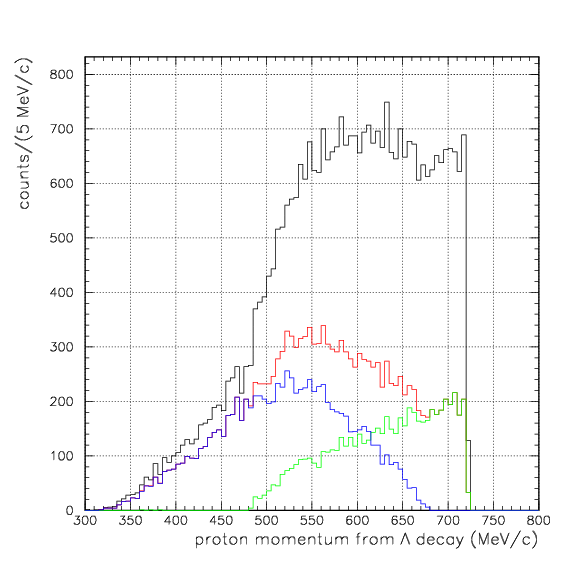
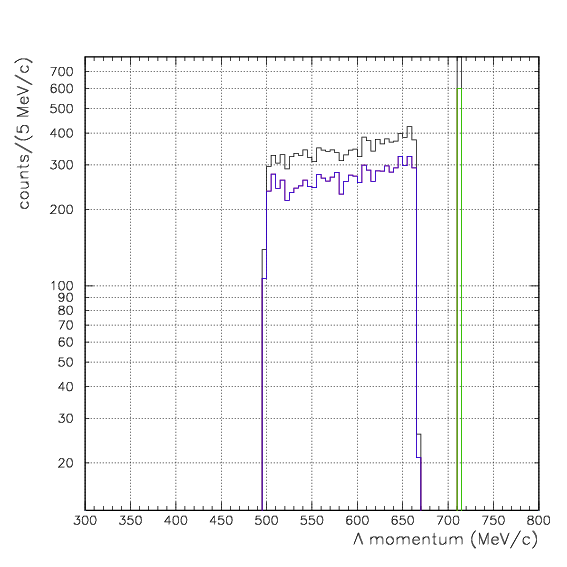
Simulated distribution of exact 3-momentum of proton and Λ under backward triton coincidence condition. The red is from stopped events on PA, and the green and the ble are from Λ and Σ0 modes, respectively.
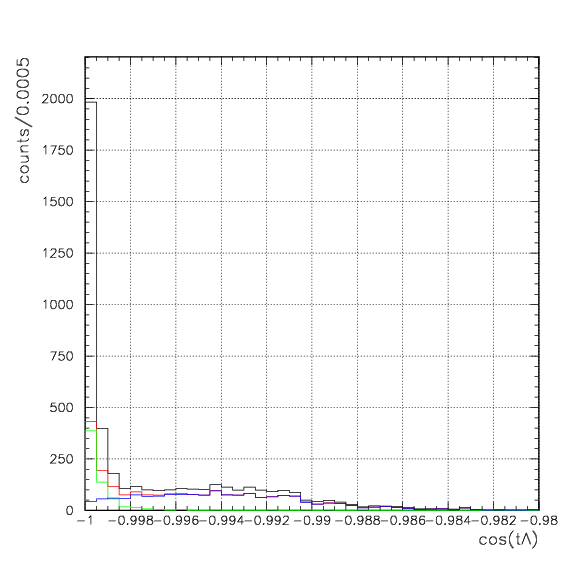
Simulated distribution of exact cos(tp) and cos(tΛ) under backward triton coincidence condition. The definition of colors are just as above.
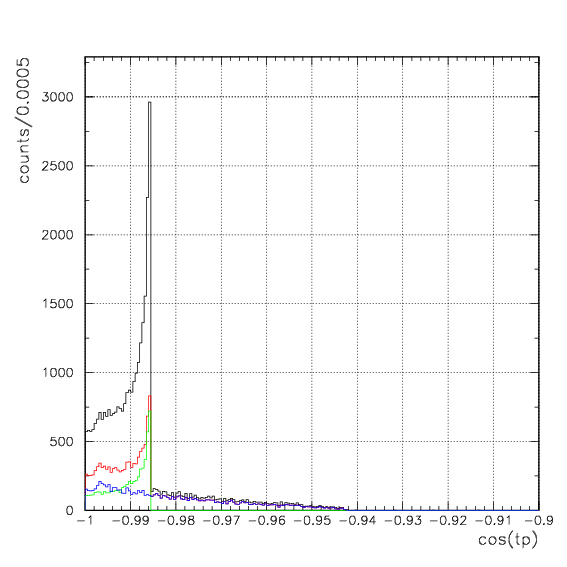
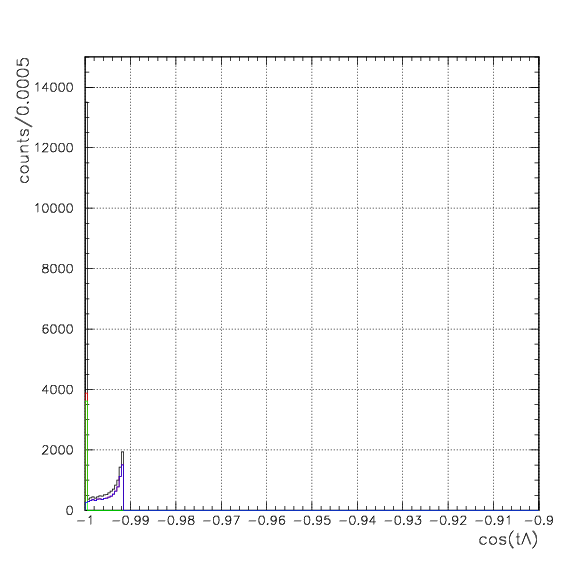
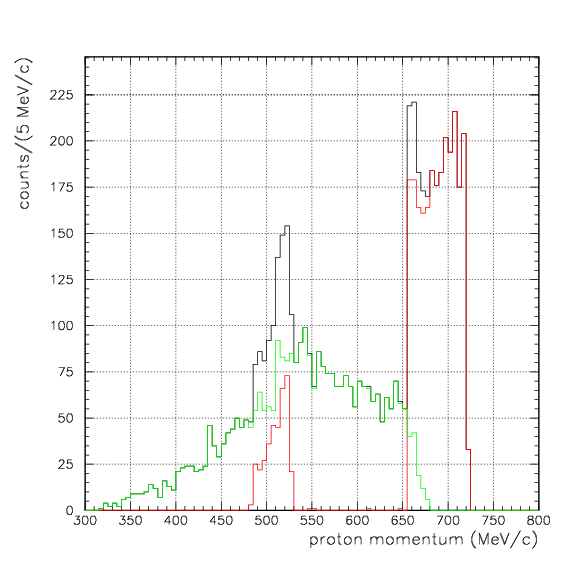
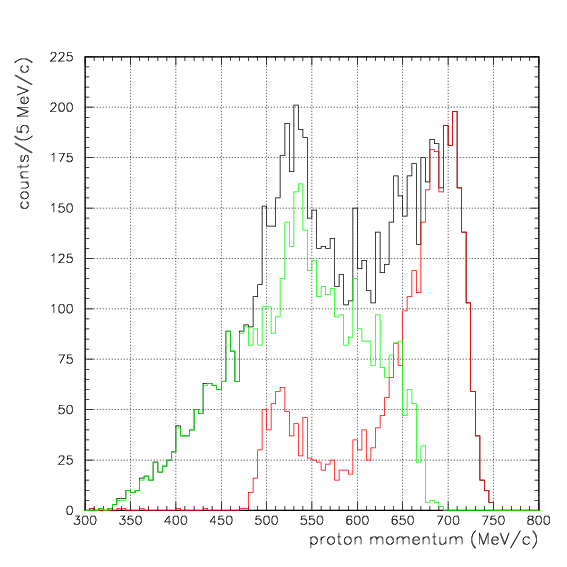
Simulated distribution of exact 3-momentum of proton for stopped triton events on PA. Note that cos(pt) < -0.990 has been imposed here. The red is by Λt events, while the green is by the Σ0t events. From the figure, it is easily explained that the observed valley at around 650 MeV/c in the backward triton coincidence proton spectrum is explained as the border between tΛ and t&Sigma0 processes.
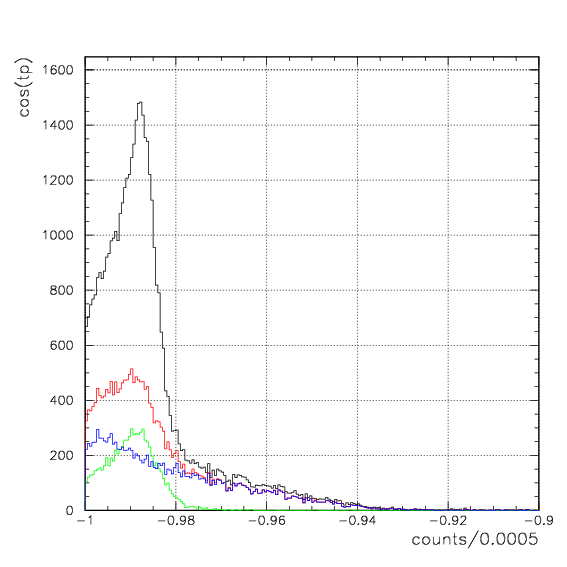
Simulated cos(tp) distribution. Experimental effects are considered as tabulated. Here the red is from stopped triton events, and the green and the blue are from Λ and Σ0 branchs, respectively.
Simulated cos(tΛ) distribution. Experimental effects are exactly considered as tabulatted. The red is from stopped triton events, and the green, blue are by Λt and &Sigma0t events among the stopped set. The Λt events are all within cos(Λt)&le-0.998.
Simulated proton momentum spectrum under backward triton coincidence condition for stopped triton. Note that cos(tp) < -0.990 is imposed here. The red is from Λt, while the green is from &Sigma0t. This reproduce well the observed spectrum shape over 500 MeV/c.
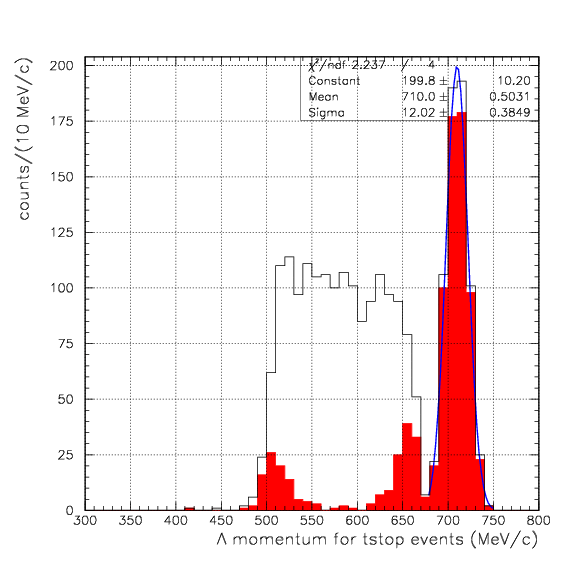
Simulated Λ momentum spectrum under backward triton coincidence condition for stopped triton events. Experimental effects are exactly considered as tabulatted. The red-filled is the spectrum obtained by cos(tΛ)≤-0.998, and its Gaussian fitting result is also shown.
Numerical Result and reaction branching ratio of the Λ t mode (preliminaly).
Here, we tabulate the numerical results of the acceptace calculation.
Generated and Accepted Event Numbers for tp mode (1)
Starting from the column 4, we add additional selection as indicated on the top row up to the 8th column. This table is a preliminary table for the subsequent one in which statistics are improved 100 times.
| Cycle | reaction | generated event No. | PDC-PA-PB hit of p | .AND. no π- hit on p-fired arm | PDC-PA hit of t | .AND.no pion hit on t-fired arm | time gate (45 nsec) + selection on analysis (p) |
|---|
| E549 | Λt | 1.91146E+06 | 88760 | 71950 | 40704 | 40693 | 28406 |
| E549 | &Sigma0t | 1.91221E+06 | 88394 | 76454 | 22477 | 22468 | 18043 |
| E570 | Λt | 1.89684E+06 | 88213 | 71616 | 40111 | 40100 | 27951 |
| E570 | &Sigma0t | 1.89635E+06 | 88451 | 76221 | 19684 | 19680 | 15728 |
Generated and Accepted Event Numbers for tp Mode (2)
A continuation of the table above, but total statistics were improved by 100 times. All selections on the table above are applyed as the default. Starting from the column 2, we add additional selections as indicated on the top row up to the 6th. &epsilonΛt is then just defined by the bold number in the 6th colmun divided by the number in the 1st colmun.
| generated event No. | Successful energy loss correction (p) | π- detection by TC-VDC | Successful energy loss correction(π-) | 1108.0<IM(pπ-)<1124.0 | cos(tΛ)<-0.99 | &epsilonΛt(%) |
|---|
| 1.91304E+08 | 2.83782E+06 | 302561 | 287321 | 253125 | 249897 | 1.31E-01 |
| 1.91145E+08 | 1.78896E+06 | 251411 | 239335 | 212832 | 178445 | 9.34E-02 |
| 1.89604E+08 | 2.78384 | 292176 | 277537 | 243159 | 239929 | 1.27E-01 |
| 1.89734E+08 | 1.57905 | 219749 | 209425 | 185598 | 151111 | 7.96E-02 |
Adopting these evaluated acceptance values of &epsilonΛt and observed peak counts of Λt events, we now obtain
Br((4He+K-)atomic -> Λ + t) = 3.2±0.5(syst)±0.4(stat)×10-4.
However, we do need to improve the accuracy of the acceptance calculation or triton selection procedure, because triton selection efficiency is not exactly considered up to now. Here, we found that a large fraction of triton from t+Λ process reach to PB, and hence triton selection procedure must be improved in the data analysis, because the present procedure developed in 2010 May 6th report invented to search for 4ΛHe-> tp is not to lose stopped triton on PA, so that the realistic efficiency of the passing-through triton is unknown, but the accurate derivation is not feasible and unneeded considering the present accuracy of other quantities. In order to check whether significant systematic deviation is found or not, we will try to accumulate as much triton as possible to apply the εΛt derived above, and try to check the consistency between the other result obtained only by PA-PB-identified triton, to which the corresponding acceptance can be calculated more accurately. Here we present the second efficiency:
&epsilon1Λt: The efficiency when only tritons detected by PA-PB 1/β VS ΔE on PB are accumulated. This efficiency is to be applied to the future detection number obtained for "triton" events on PA-PB.
The calculated efficiency, &epsilon1Λt are presented below, as the continuation of the tables above.
| triton on PB / &epsilon1Λt(%) |
|---|
| 114663/5.99E-02 |
| 9281/4.86E-03 |
| 97525/5.14E-02 |
| 4569/2.41E-03 |
In the next report, we will try to identify the triton on PA-PB and apply the ε1Λt presented above, to check whether the result is consistent to the overall result obtained by the all triton events and εΛt.
A comparison of the measured and expected peak center and width
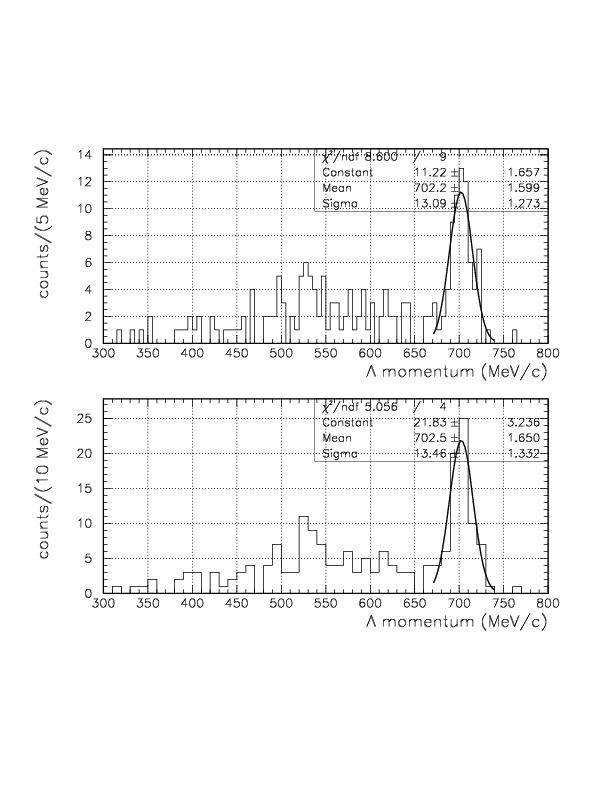
Performing naively a Gaussian fitting of the measured momentum peak of Λ,
we obtain the peak area, center and the standard deviation of 73.6 ± 8.6, 702.5 ± 1.5 and 13.5 ± 1.5 MeV/c, respectively. The peak area is consistent to the value by a naive integratuion. By some reason, the peak center is systematicly shifted by 9.2 ± 1.5 MeV/c toward the lower side, and the resolution value is consistent to the calculated value of ~12 MeV/c.
Λ momentum spectrum and fitting result of a Gaussian. The top panel is with 5 MeV/c binning, wile the bottom is with 10 MeV/c.
