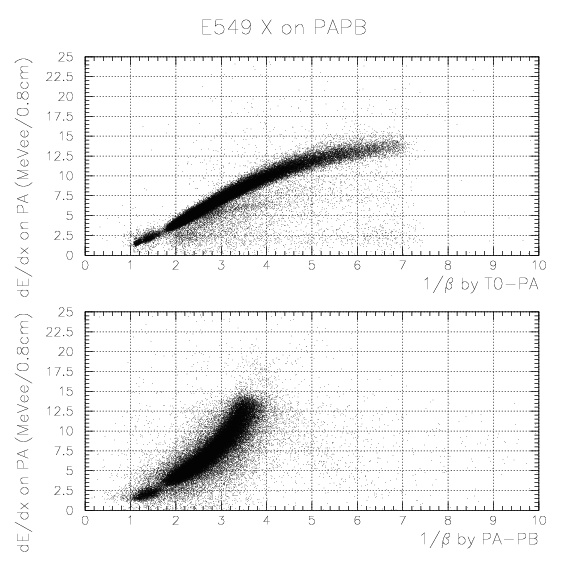
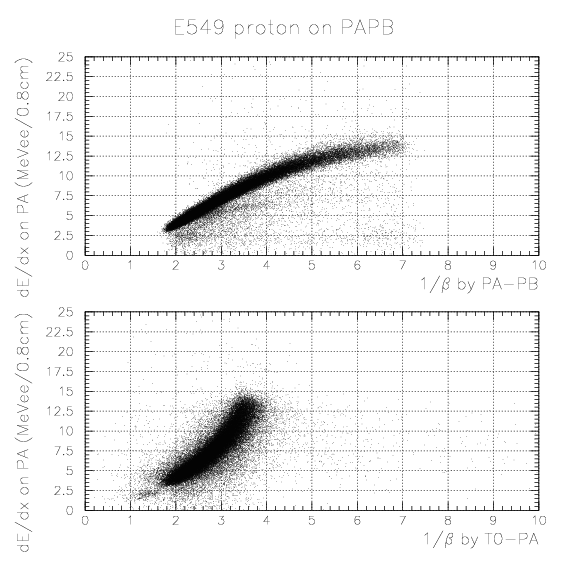
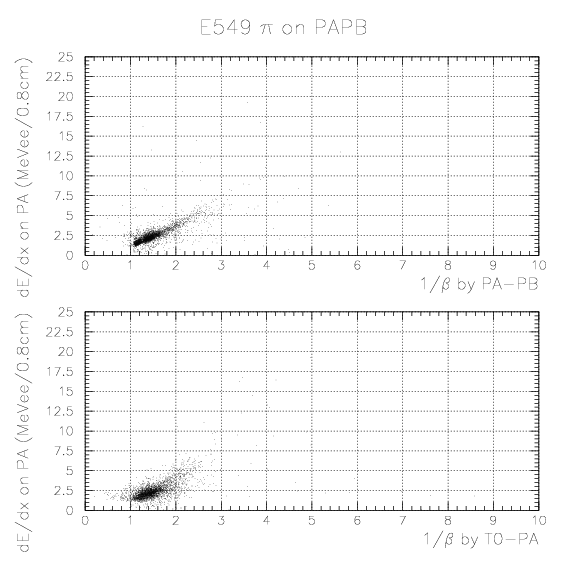
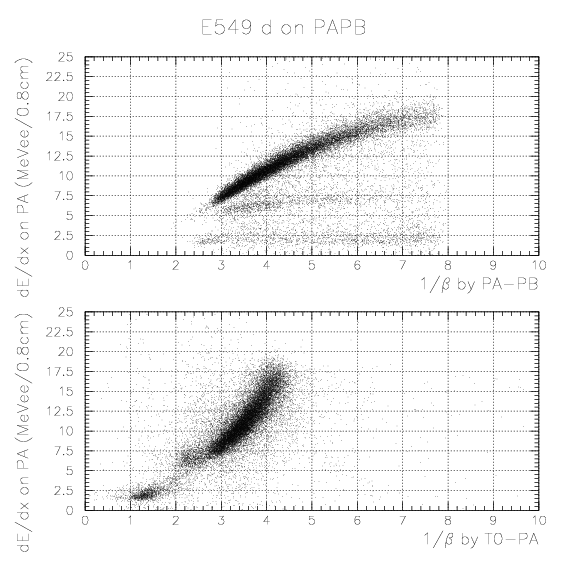
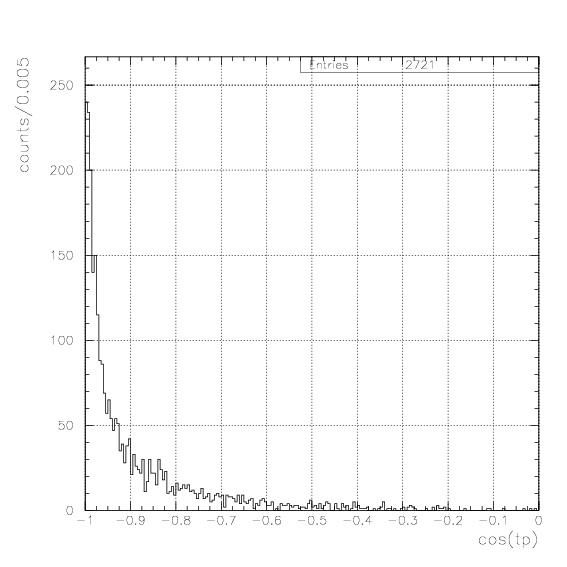
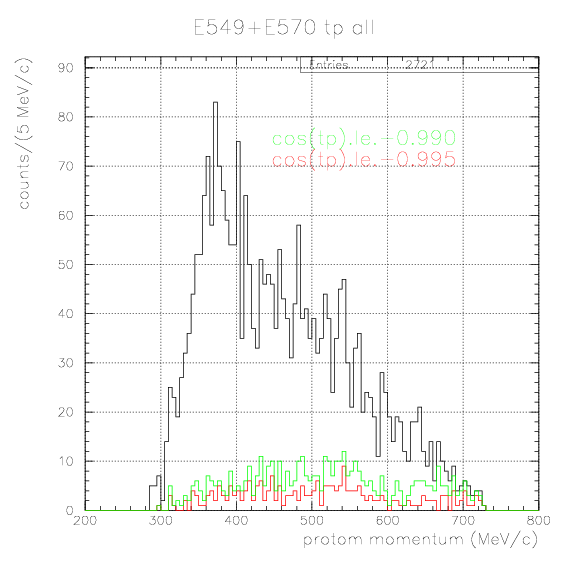
Here, we search for
4&LambdaHe -> t+p(~509MeV/c) (2)
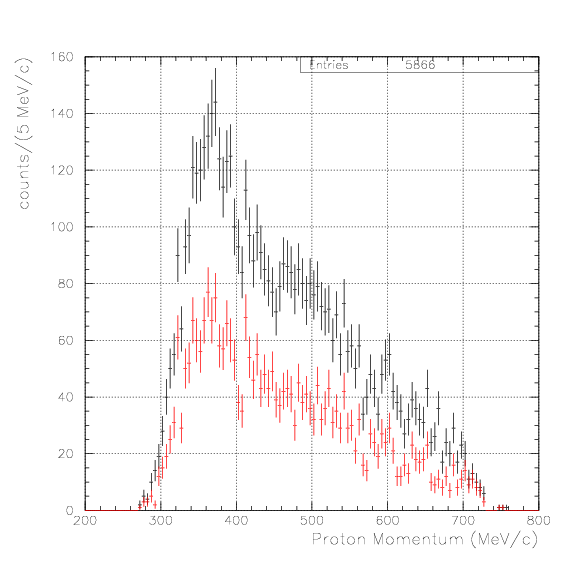
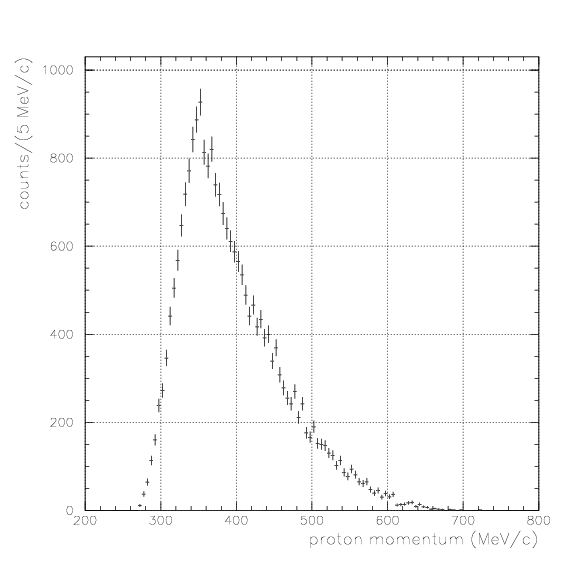
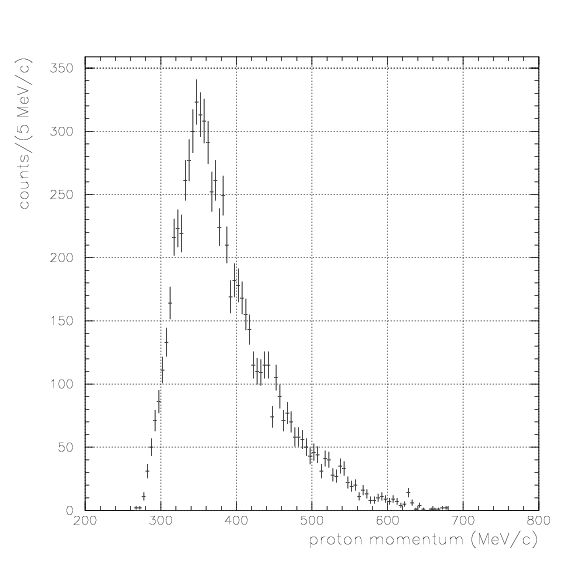
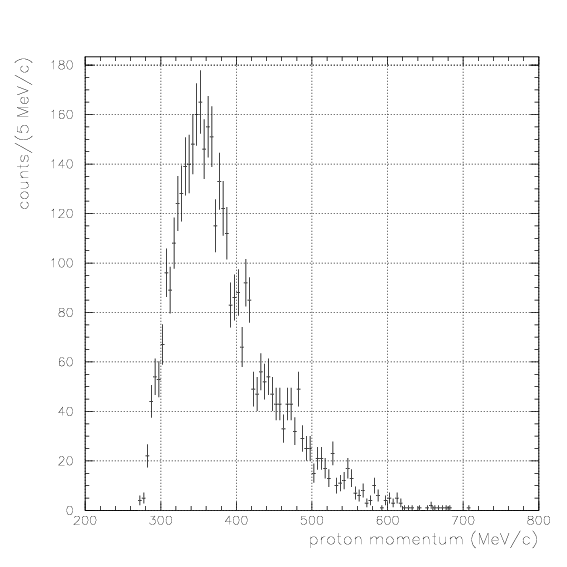
decay channel on proton momentum spectrum, with two/three analysis methods as listed below:1. X on PDC/PA + p on PDC/PA/PB coincidence events. Only track information of particle X is used.
1'. X on PDC/PA + p on PDC/PA/PB coincidence events. PA(L)-PA(R) TOF and Energy loss on PA is studied.
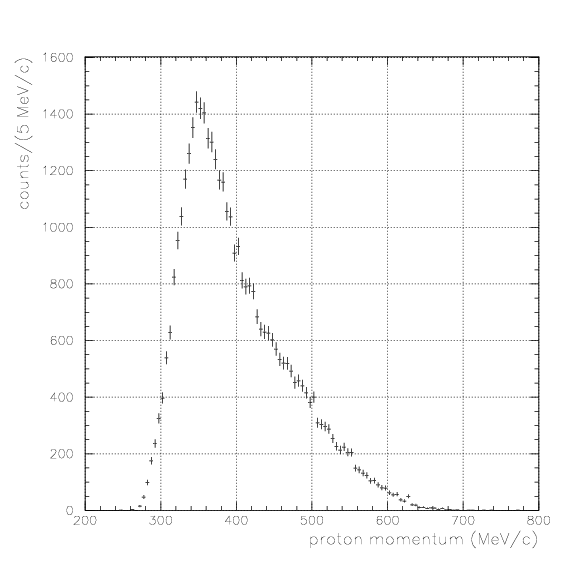
2. Inclusive p on PDC/PA/PB events, with delayed event selection with T0-PA TOF.
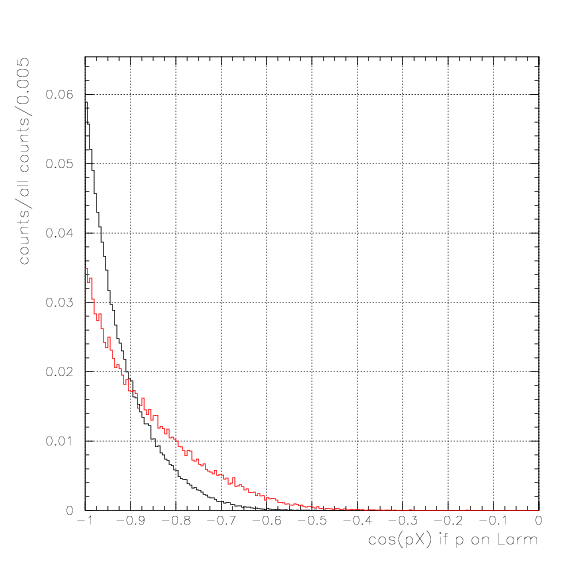
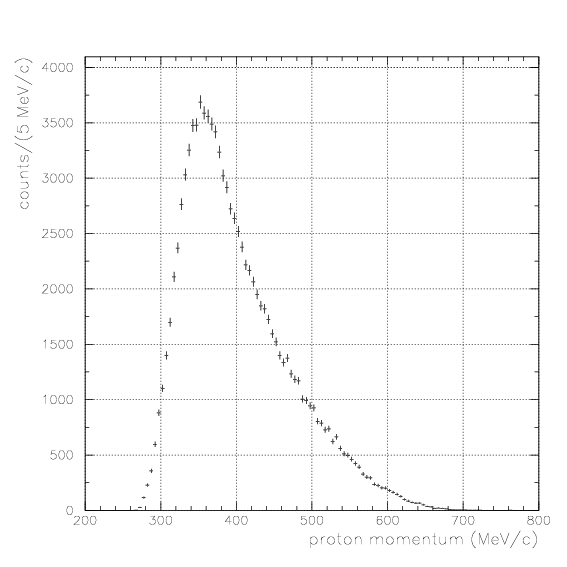
The acceptance study is already done in advance, and all spectra are presented by E549+E570 100% statistics.In this case, Energy/TOF/PID are not generally available for particle X fired only PDC/PA without PB, and only the track information on PDC is used for the event selection for the proton momentum spectrum. In this case, particle X is not generally stopped one - they tend to have so large incident angle to PA/PDC, that they cannot fire PB wall.
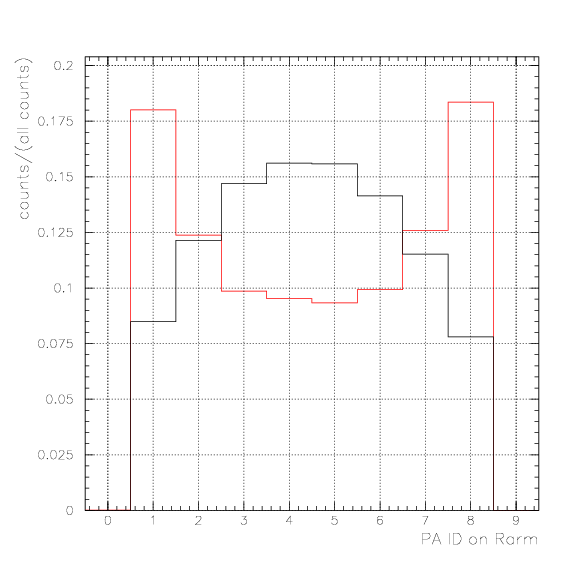
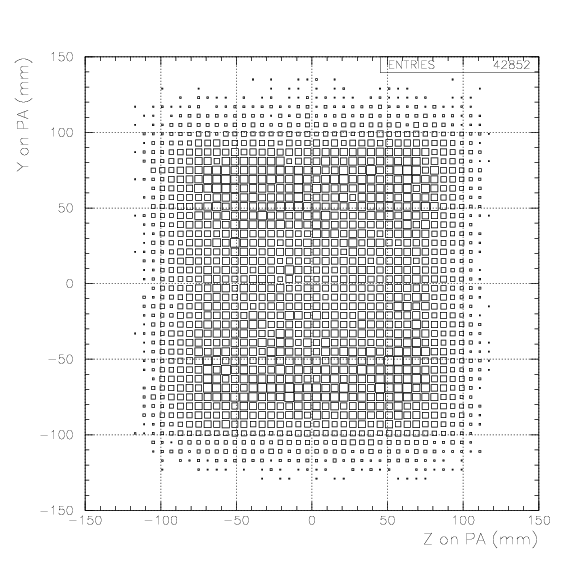
By requiring large delay, we expect to enhance following processes:
1. Nuclear reactions occured from meta-stable atomic orbit, with 4.2(all)-3.5(free decay) ~0.7 %/stoped K-
2. Decay of hypernuclei, 4&LambdaH and 4&LambdaHe, with 0.9 +1.8=2.7%/stopped K^-.
As the time difference be so large, S/N ratio gets smaller. We examine the inclusive spectrum under various gate conditions, 0.4~0.8,0.8~1.2,1.2~1.6,1.6~2.0, and >2.0. No clear signal is seen.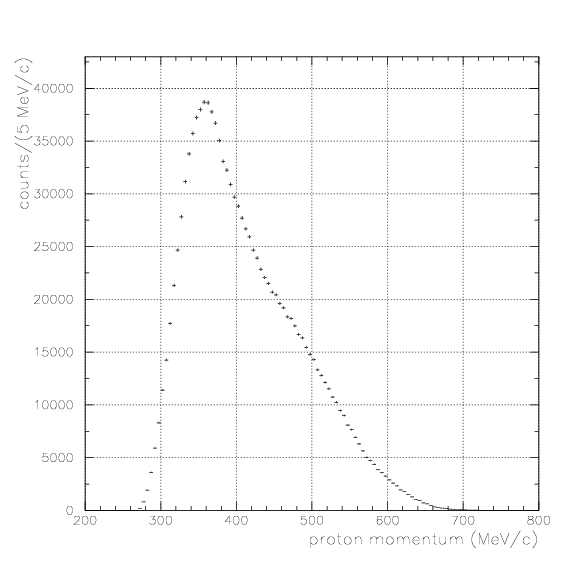
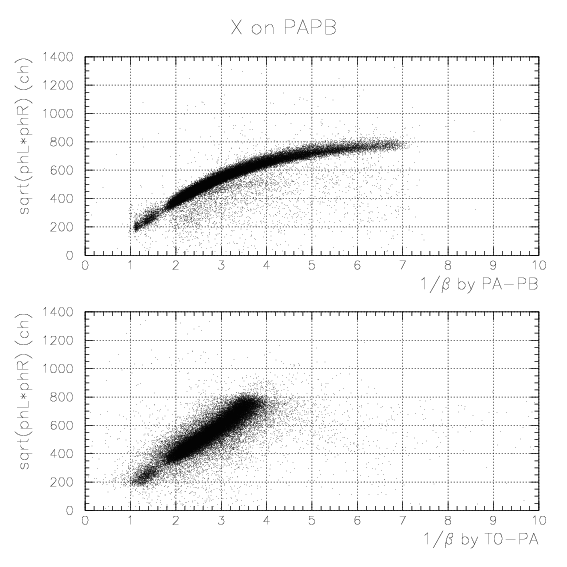
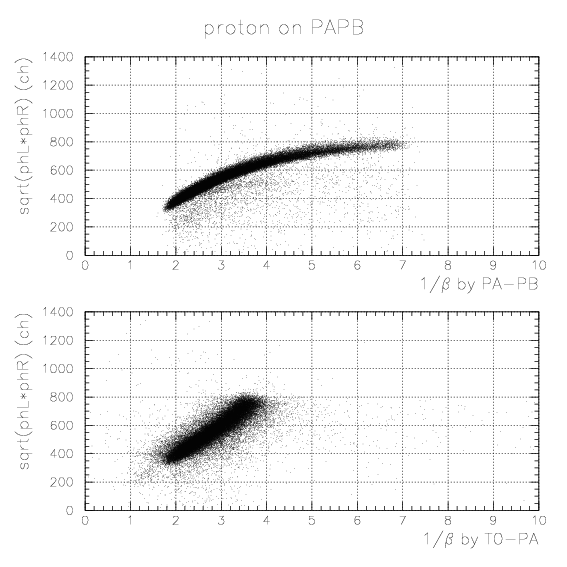
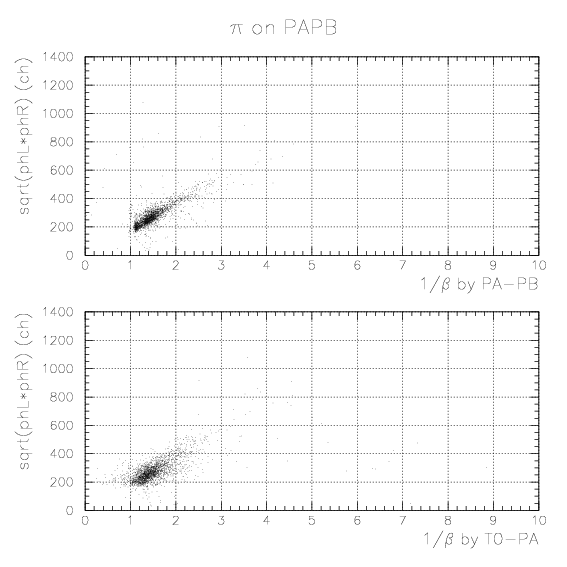
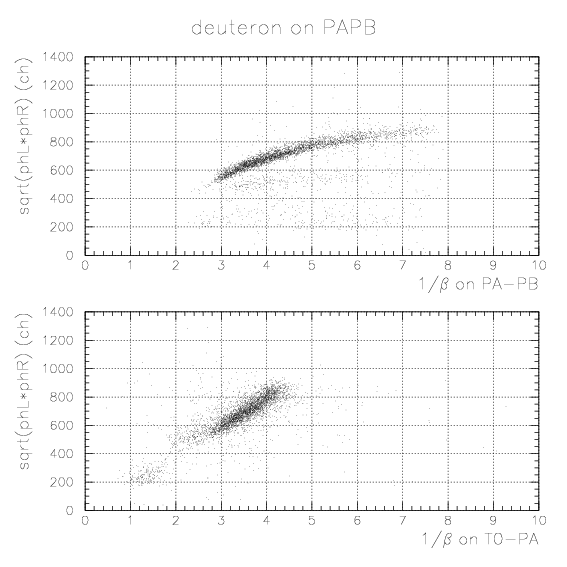
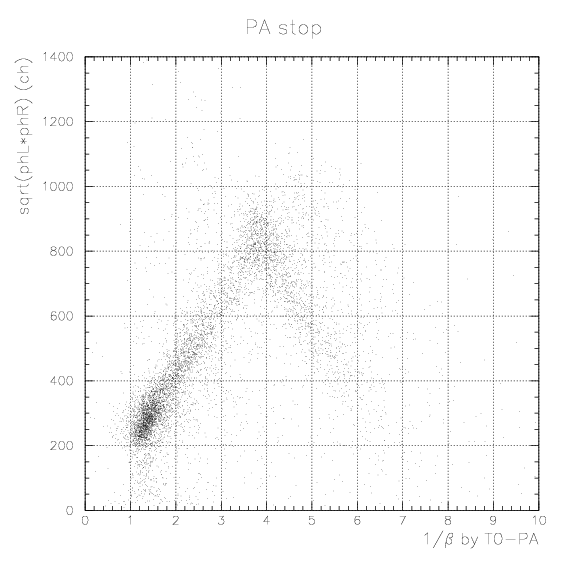
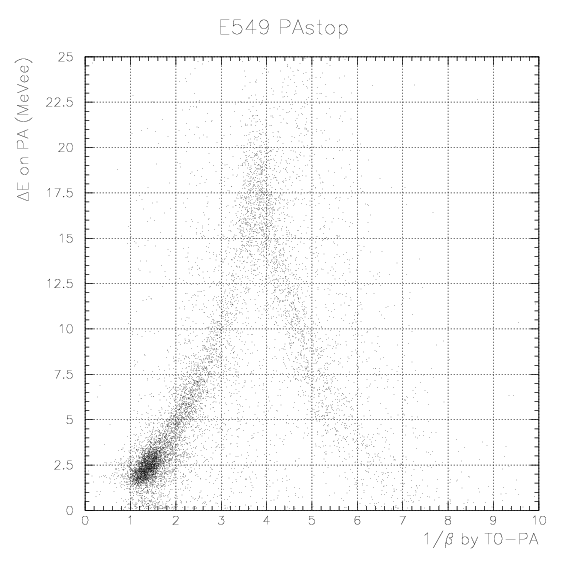
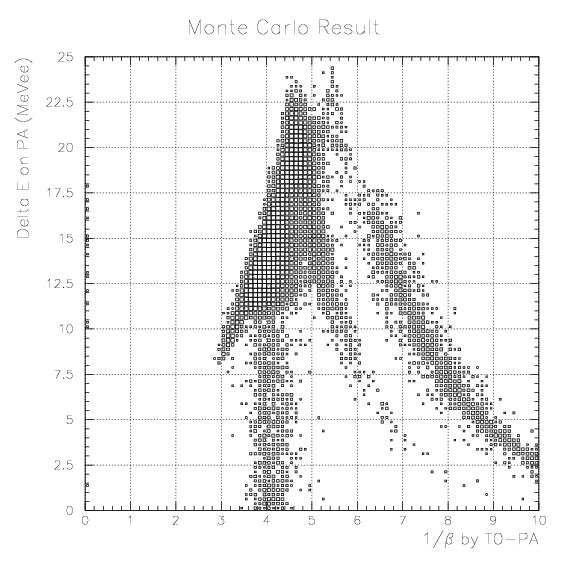
1. Simulate the expected energy loss on PA as the function of 1/&beta of proton. Peak position by K-stopped->&mu- &nu decay is also simulated. The results are tabulatted below.
| incident particle | Normalized light output (MeVee/0.8cm) |
|---|---|
| &mu+(235 MeV/c at the generation) | 1.307(Landau fit) |
| p(2.4<1/&beta<2.6) 409.9 MeV/c at the exit | 5.308(Gaussian fit) |
| p(4.4<1/&beta<3.6) 280.0 MeV/c at the exit | 8.247(Gaussian fit) |
| p(4.4<1/&beta<4.6) 214.1 MeV/c at the exit | 10.534(Gaussian fit) |
| p(5.4<1/&beta<5.6) 173.7 MeV/c at the exit | 12.058(Gaussian fit) |
| p(6.4<1/&beta<6.6) 146.2 MeV/c at the exit | 12.970(Gaussian fit) |
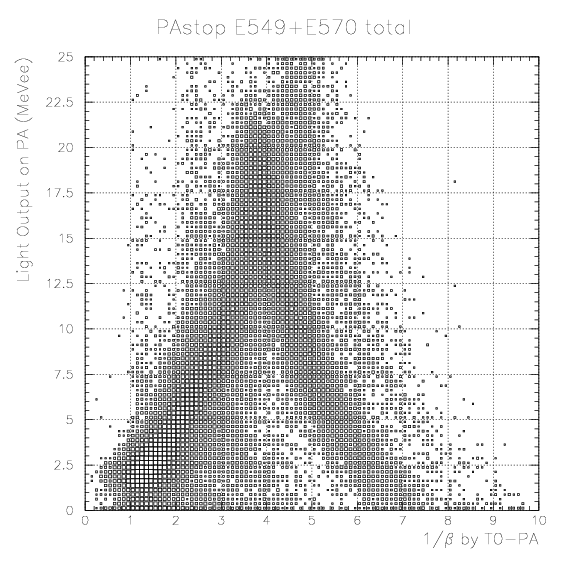
2. By plotting simulated energies (MeVee) as the function of detected sqrt(phL*phR) for sample 1/&beta points and fitting by relevant functions, we obtain segment-by-segment sqrt(phL*phR) to energy (MeVee) convertion function, fi(E), as
fi=fi(sqrt(phL*phR)),
where i is the PA segment ID (i=1~8 for L and R). The procedure is quite similar to that adopted for T0. The fi are determined cycle-by-cycle near the K+ calibration runs, then the part-by-part gain walk is considered as described nextly.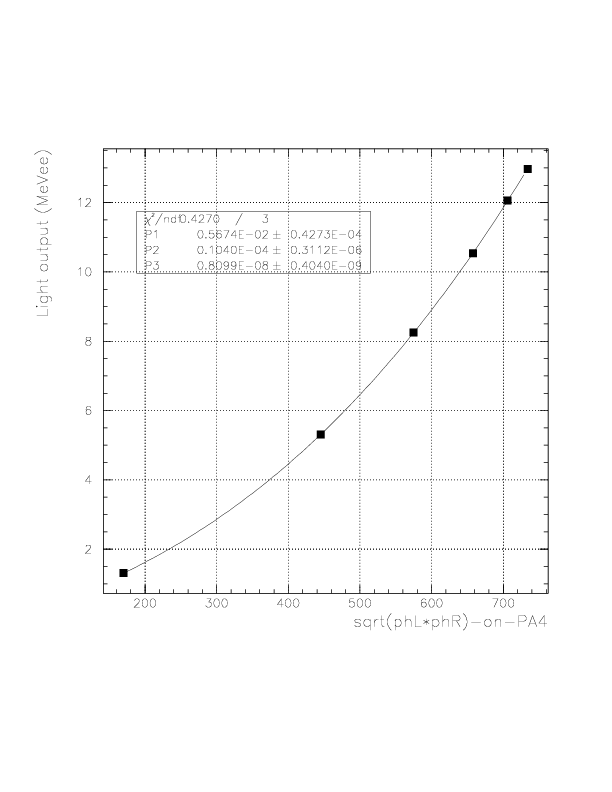
dE/dx=pdcv_x*sqrt(phL*phR) (ADCch/0.8cm),
where pdcv_x is the direction cosine of proton measured by PDC.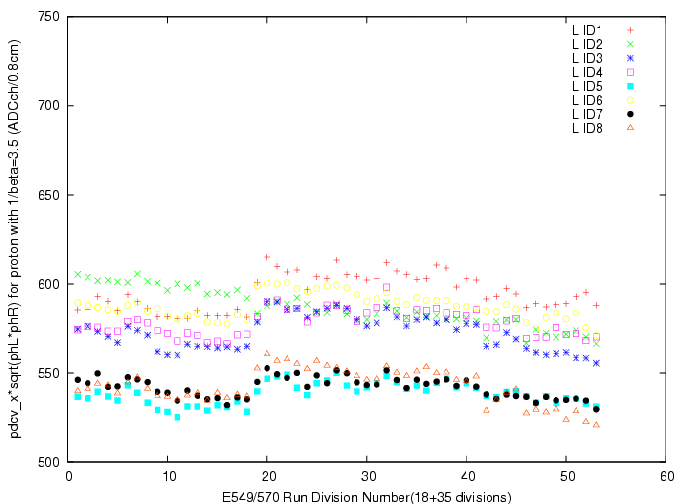
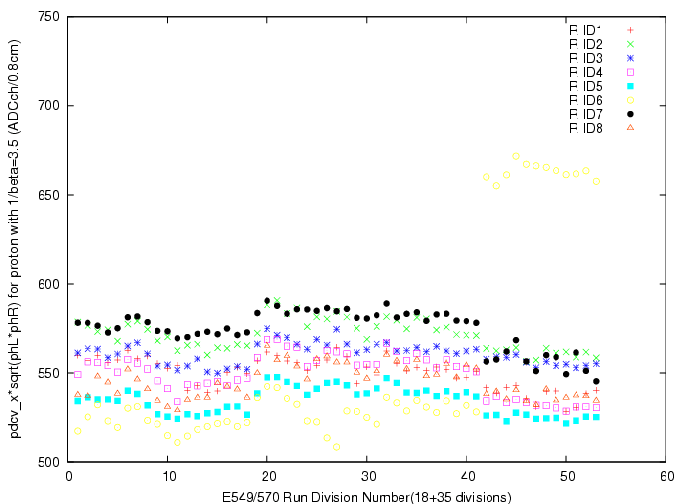
Part-by-part gain variation is then considered. The convertion function for part Npart is defined as
fi(Npart,ph) = fi(ph')
, where ph' is defined asph' = ph*(ph_0/ph_Npart).
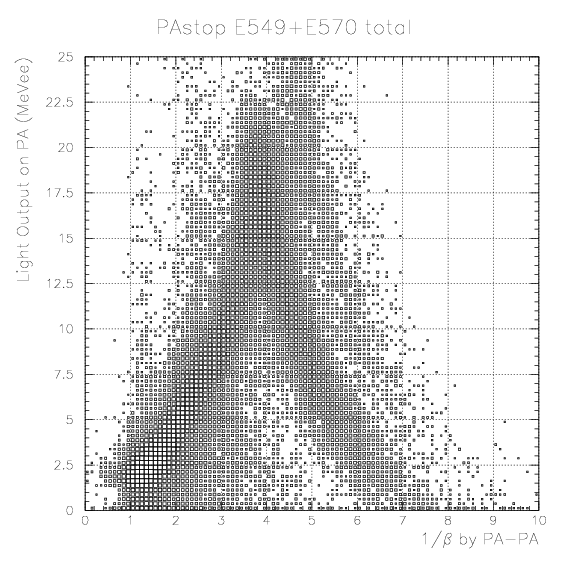
where fi(ph) is conversion function determied at the part including the K+ calibration run (part 13+14/24+25 for E570 1st/2nd cycles, respectively), ph_0 is the peak position of pulse height for the specific part, ph_Npart is the peak position of pulse height for the part where we intend to convert the pulse height into the light output, and ph is measured pulse height value.TOF(X:PA-PA) = Time(X:PA)-{Time(p/&pi:PA)-TOF(p/&pi:PA)},
where Time(X:PA) is PA-defined time of particle X, Time(p/&pi:PA) is PA-defined time of counter-detected p/&pi, and TOF(p/&pi:PA) is calculated TOF of p/&pi from its generation until reaching the PA surfice. For stopping particle X on PA, the TOF is always well-defined, since counter-detected particle is always imposed. Adopting the PA-PA TOF, we expect more clean correlation between light output and 1/&beta both determined only with PA. The final form of the PID is presented nextly.