Today's Progress 26. Dec. 2006
TC TOF Analysis
Method
Since we have now the KstopCharged triggered event set, &gamma-ray events are available even on TC_B/C/D with TC_A as VETO. Adopting that, we examine a TOF analysis with B layer, especially for the re-construction of &Lambda/&Sigma hyperon.
The analysis procedure is as follows. Let we define the time residual, DeltaT(T0->TC_B), as
DeltaT(T0->TC_B) = Ttc_b - Tt0 - TOFkstop(z) - TOF_&gamma,
where Ttc_b is LR meantime of the fired B segment, Tt0 is T0 time established by T0-PA-PB analysis, TOFkstop(z) is the simulated kaon TOF from T0 to its stop. TOF_&gamma, TOF of &gamma from its production to TC_B, is defined as
TOF_&gamma = L_TOF/c,
L_TOF = sqrt((TC_x-Vx)**2+(TC_y-Vy)**2+(TC_z-Vz)**2,
where (TC_x,TC_y,TC_z) is &gamma detection point on TC, (Vx,Vy,Vz) is reaction vertex determined by BLC-PDC. TC_x is determined by the L-R time difference, and TC_y and TC_z are represented by the segment x/y-center. Then, we examine a slewing correction procedure to the quantity DeltaT(T0->TC_B). Note that we adopt Compton-like &gamma-ray events.
Process of Analysis
The analysis procedure is as follows:
1. Construct the conversion function from L-R time difference VS x on TC with charged particle track. Applying the conversion function, calculate distance-of-flight for neutral particle.
2. Apply the slewing correction to the DeltaT(T0->TC_B), namely, study f(sqrt(phL*phR))
3. Perform part-by-part(or run-by-run) tune of TC time walk.
4. Study g(&xi) with 100% &gamma-ray statistics.
L-R time difference VS x on TC conversion
First, L-R time difference is compared to the VDC-detected x position on B/C layers for run 69-100. By using that, time difference->x conversion function is constructed, to be applied to neutral particle analysis. The conversion function, X(T) is defined as a linear function of the L-R difference, T(L-R):
X(T) = a * T(L-R) + b,
where a and b is determined to fulfill the relationship,
X(VDC) = a * T(L-R) + b,
where X(VDC) is the VDC-detected x position of the TC segment. Note that the slope, a, is the half of the effective light velocity inside the segment.
L-R time difference (abscissa) VS VDC-measured x position (ordinate) for B(top) and C(bottom) from charged particle events.
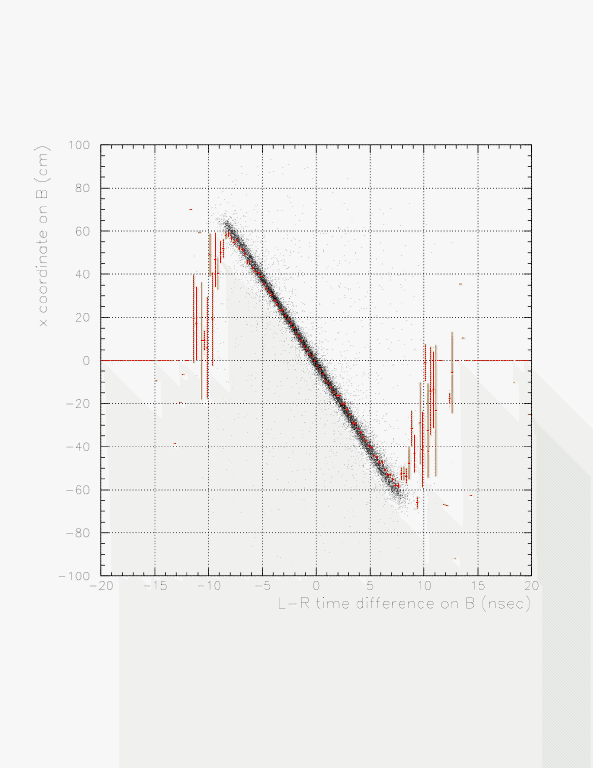
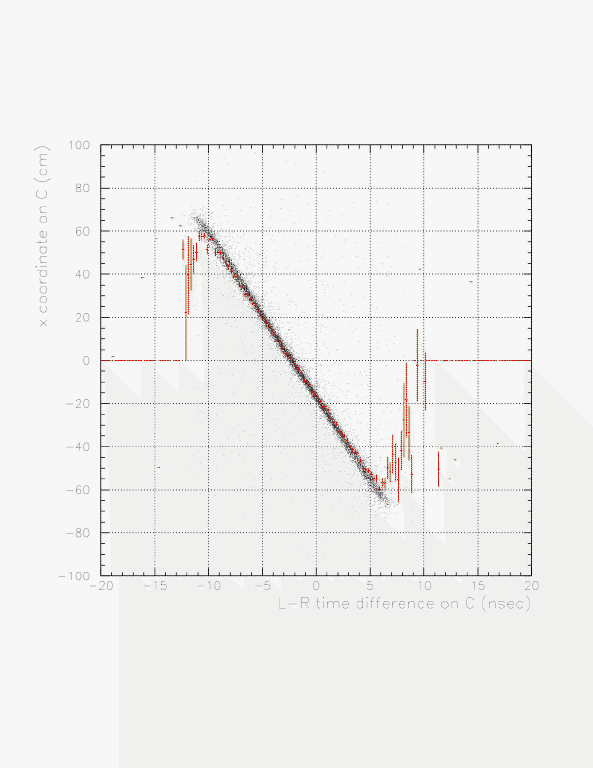
Performance of TC B/C segments studied by charged particle events. Resolution value is taken from the value at run69.
| Layer | UD | ID | Light Velocity (cm/nsec) | x Resolution &sigma (cm) |
|---|
| B | UP | 1 | 15.4 | 2.9 |
| B | UP | 2 | 15.4 | 3.0 |
| B | UP | 3 | 15.4 | 2.8 |
| B | UP | 4 | 15.5 | 2.8 |
| B | UP | 5 | 16.0 | 3.5 |
| B | DOWN | 1 | 15.0 | 2.8 |
| B | DOWN | 2 | 14.9 | 2.8 |
| B | DOWN | 3 | 15.2 | 2.6 |
| B | DOWN | 4 | 15.1 | 2.9 |
| B | DOWN | 5 | 15.0 | 2.8 |
| C | UP | 1 | 14.7 | 3.0 |
| C | UP | 2 | 14.9 | 2.8 |
| C | UP | 3 | 14.8 | 2.6 |
| C | UP | 4 | 14.7 | 2.8 |
| C | UP | 5 | 14.8 | 2.9 |
| C | DOWN | 1 | 14.5 | 2.9 |
| C | DOWN | 2 | 14.7 | 2.7 |
| C | DOWN | 3 | 14.6 | 2.6 |
| C | DOWN | 4 | 14.7 | 2.7 |
| C | DOWN | 5 | 14.5 | 2.7 |
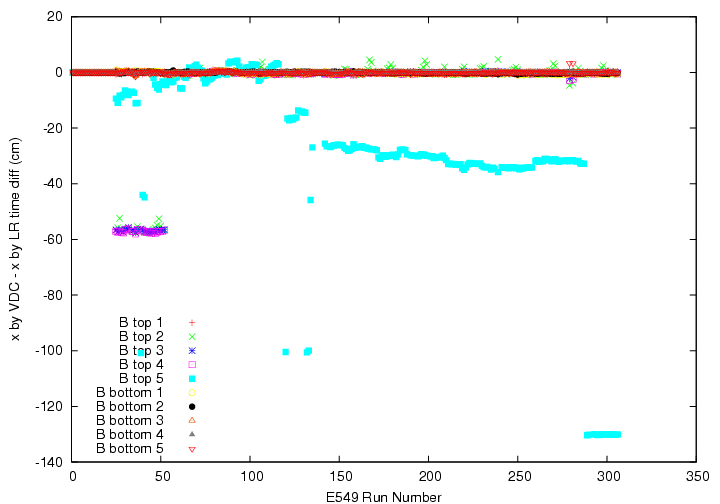
Since the time walk is naturally expected, we do need to check the stability of the function. We found a hardware error (maybe due to bad TDC channel) on B, top ID5, as the result.
Run-by-run segment-by-segment variation of the center of residual of x by VDC - x by LR time difference on TC B_layer. Except for top ID5, conversion functions work well. On ID5, we have TDC channel error up to run 288. We added additional delay cable between run 52 and 53 for top 2,3,4.
Run-by-run segment-by-segment variation of the center of residual of x by VDC - x by LR time difference on TC C_layer. Conversion functions work well for all of them. We added additional delay cable between run 52 and 53 for top 1R. D layer thresold had been increased between run 44 and 45, and it might affect the C layer timing.
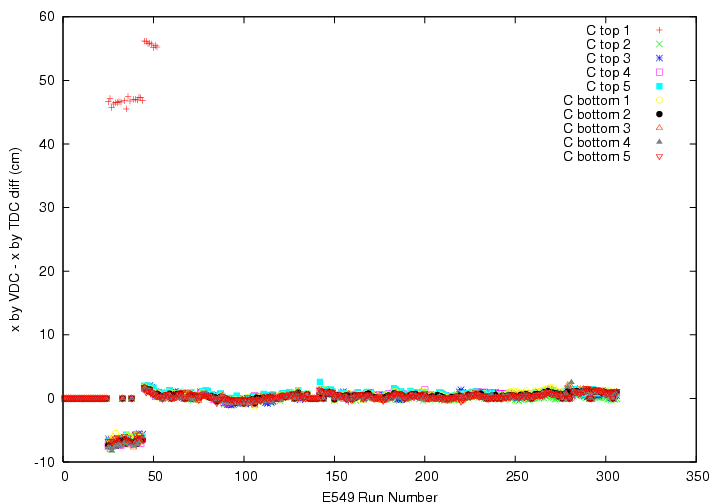
We correct observed run-by-run deviation of the position as run-dependent constant term, assuming that the slope of the linear function is quite stable, i.e.
X(T) = a * T(L-R) + b + c(idrun).
Slewing Correction
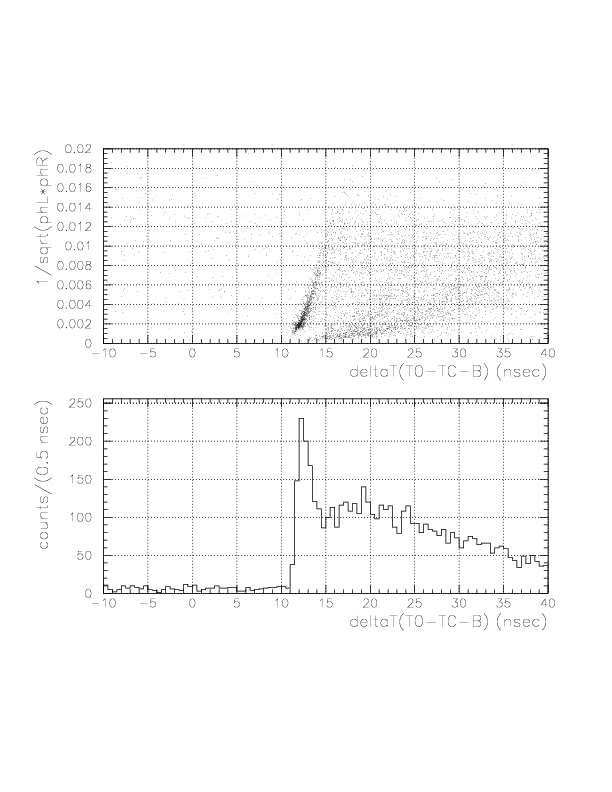
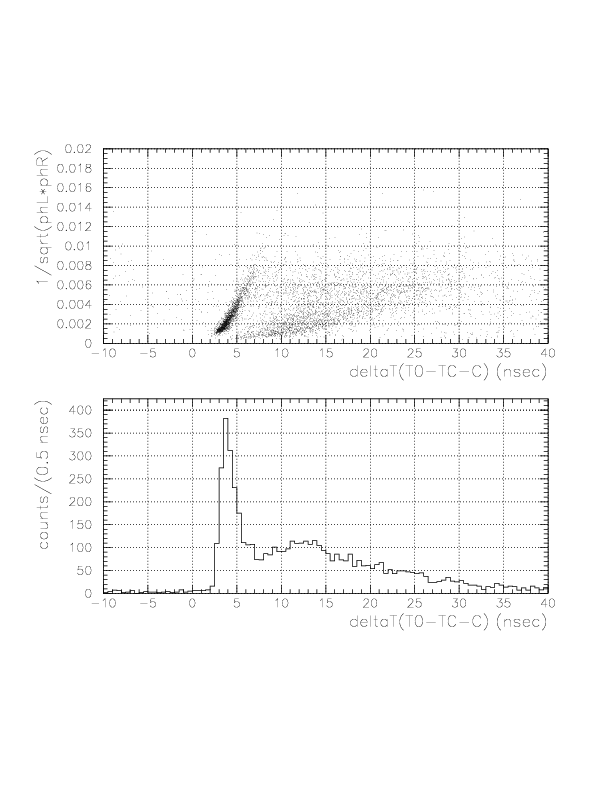
By studying the time residual, deltaT(T0->TC_B/C), for neutral particles, we perform slewing correction and time offset tune. Then, correction function and offset obtained is applied to the charged events.
Correlation between 1/sqrt(phL*phR) VS time residual for neutral particles (top) and 1-dimensional plot of the time residual for B-layer top ID3.
Correlation between 1/sqrt(phL*phR) VS time residual for neutral particles (top) and 1-dimensional plot of the time residual for C-layer top ID3.
Resulting correction function (Green) overlayed onto the correlation between 1/sqrt(phL*phR) VS time residual for neutral particle (top), the correlation after the subtraction of the dependence (center), and its 1-dimensional projection onto x-axis, for C top ID1.


part-by-part tune of TC time walk
We study the time-dependence of the Gaussian center of DeltaT(T0->TC_B/C) with &gamma-ray events. Because of the statistical limit, we cannot perform run-by-run segment-by-segment tune. Therefore, we devide the production into 30 parts, and perform part-by-part segment-by-segment tune for B/C layers.
part-by-part time walk of B-layer segments determined by &gamma-ray events.
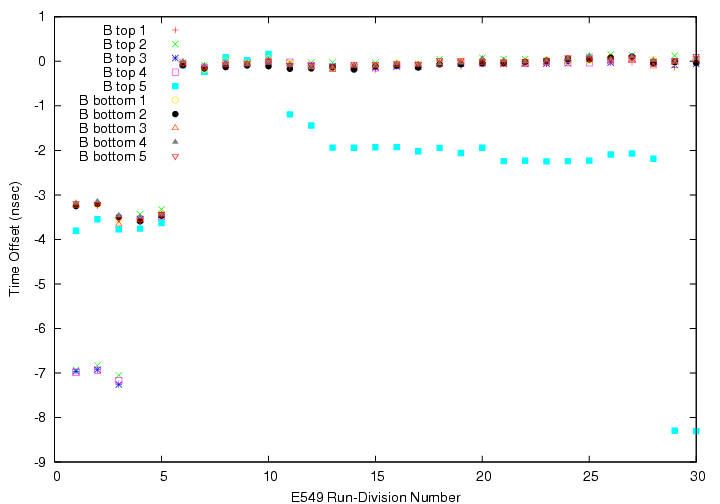
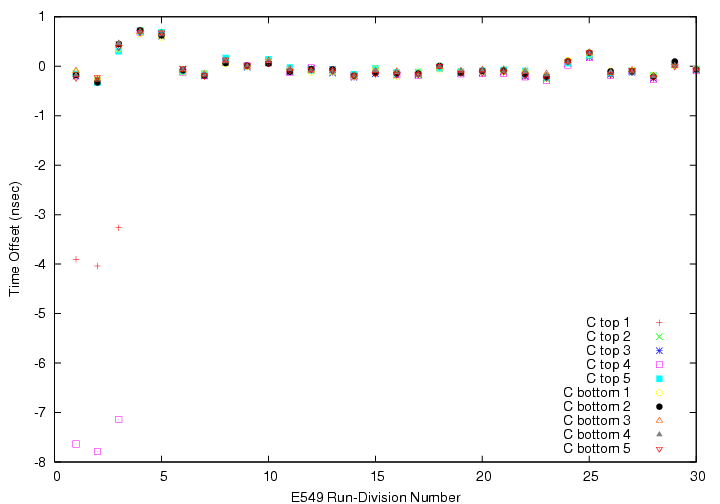
part-by-part time walk of C-layer segments determined by &gamma-ray events.
Study of g(&xi)
Since we have now enough statistics of &gamma-ray events, now we can study g(&xi).
Correlation between ph-corrected time residual (horizontal) and x on TC (vertical) for neutral particles on B/C layer segments.
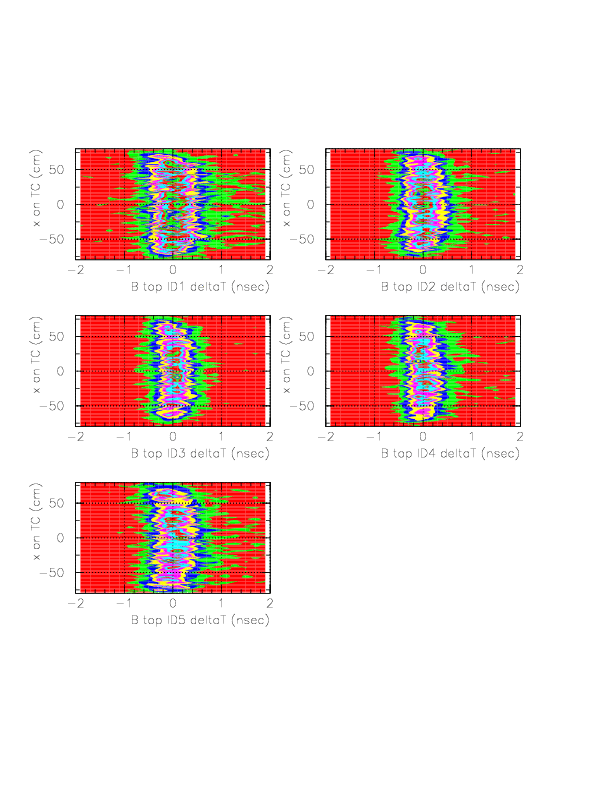
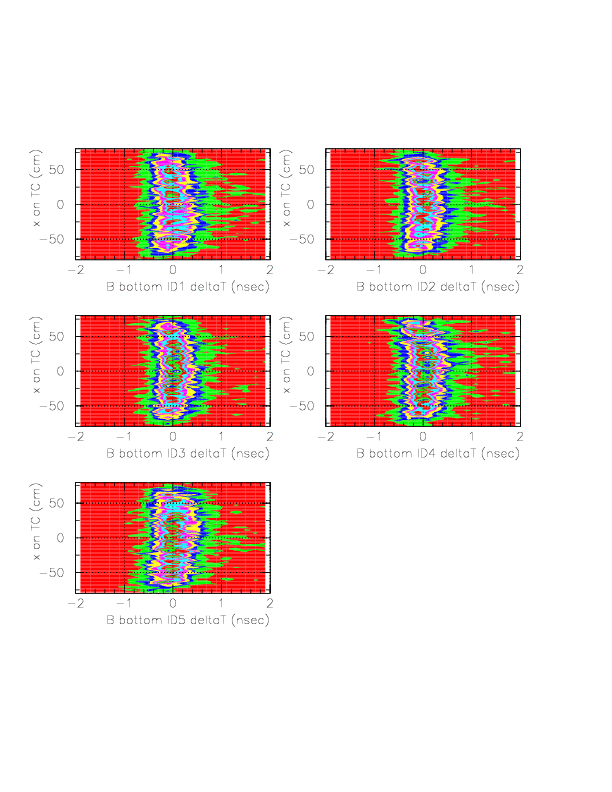
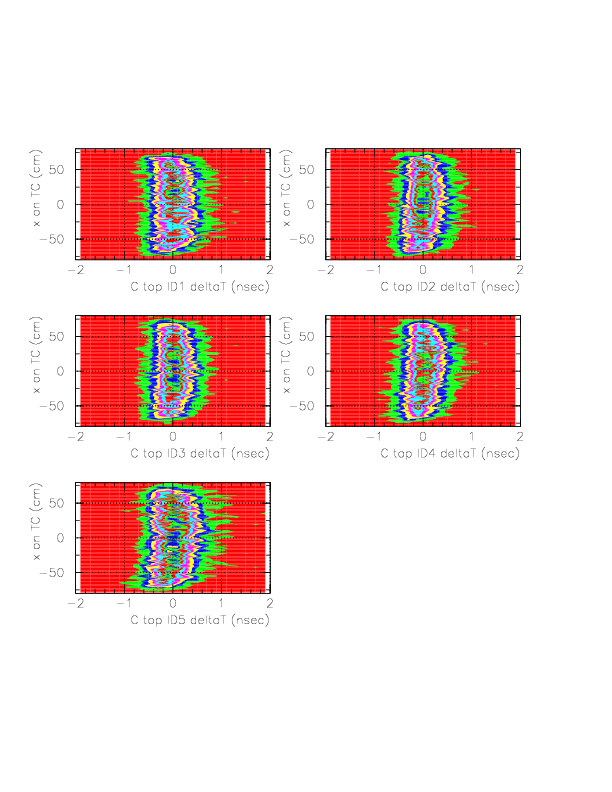
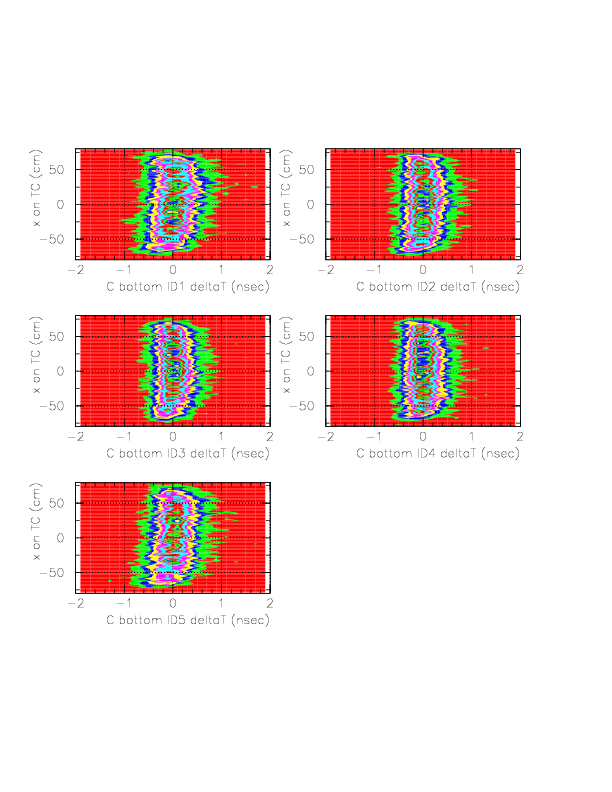
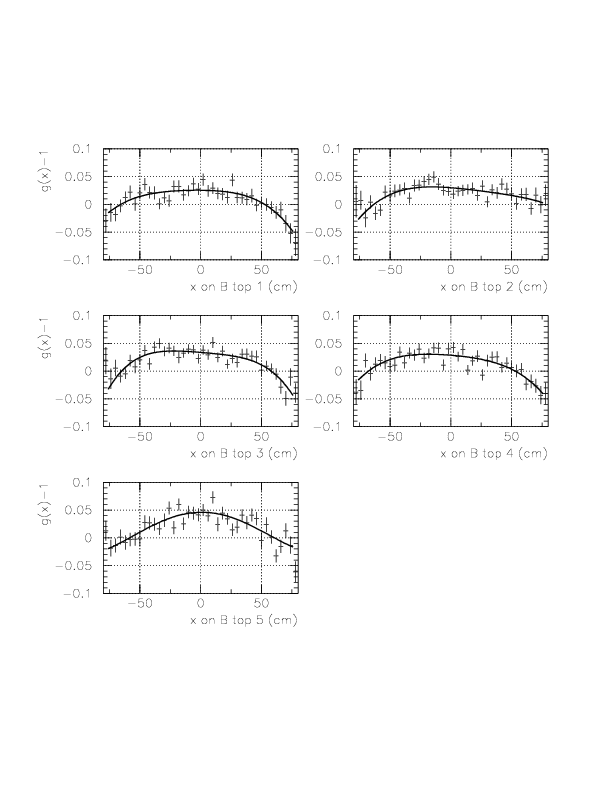
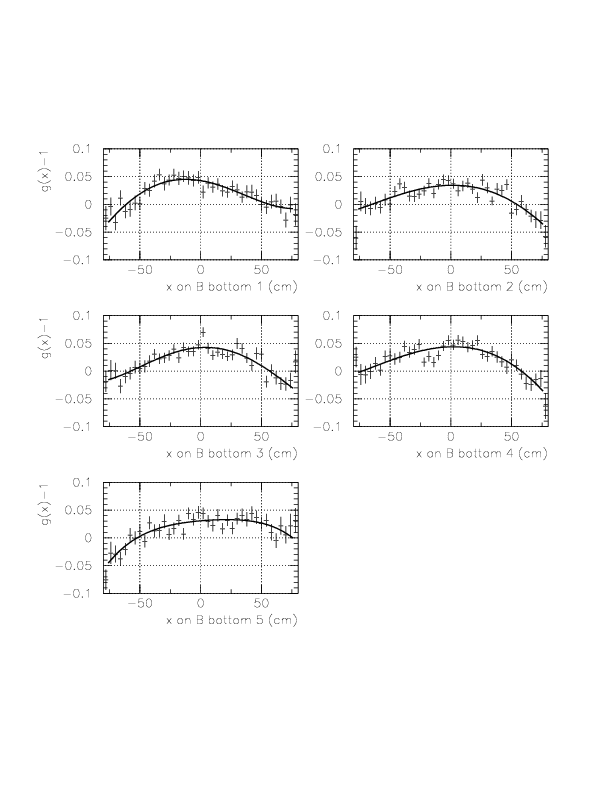
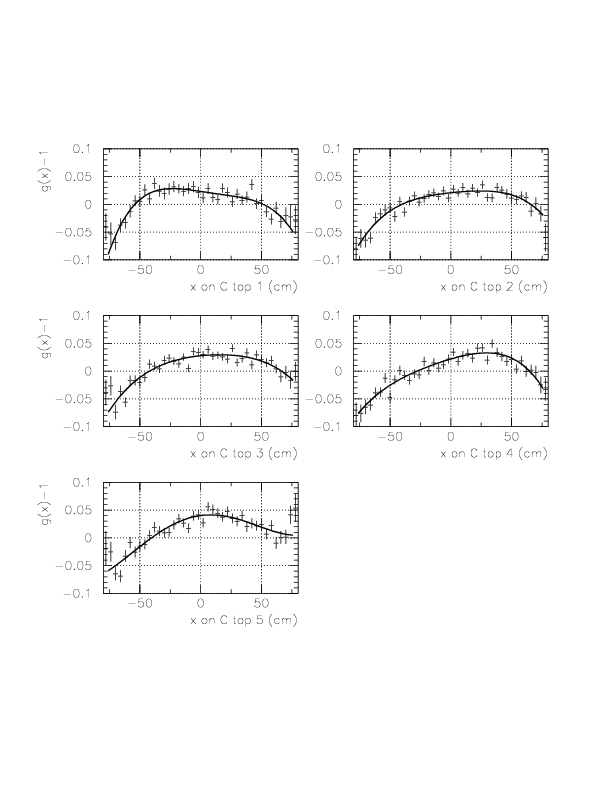
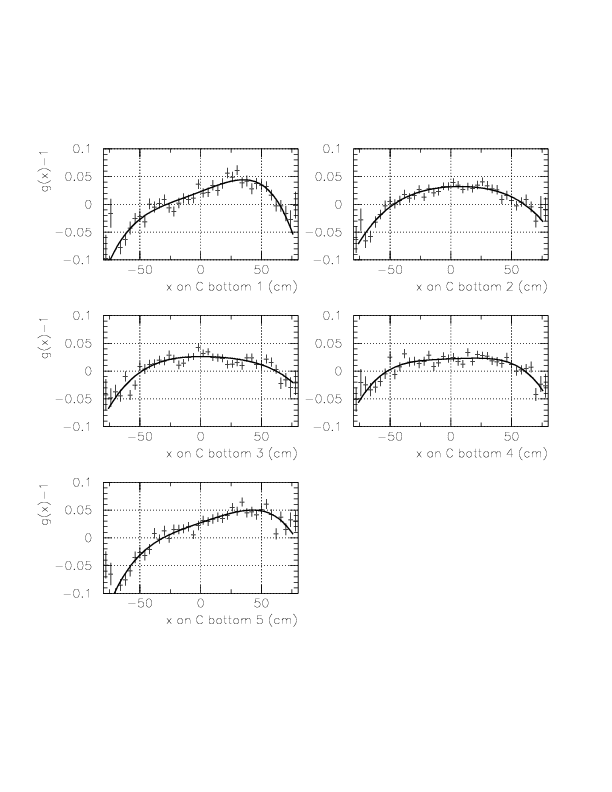
Now, we determine g(&xi) as a forth order polinomial of &xi. In order to determine g(&xi), we study the quantity, (DeltaT(T0->TC_B/C) - f(1/ph) - const(idpart))/f(1/ph), according to the approximational equality,
DeltaT(T0->TC_B/C) = f(1/ph)*g(&xi) + const(idpart)
= f(1/ph)+f(1/ph)(g(&xi)-1.0) + const(idpart).
Performance study of TOF with B/C layers for &gamma-ray
Here, we study the distribution of the slew-corrected time residual,
DeltaT'(T0->TC_B/C) = DeltaT(T0->TC_B/C) - f(1/ph)*g(&xi) - const(idpart),
and examine the performance of the T0->TC TOF measurement.
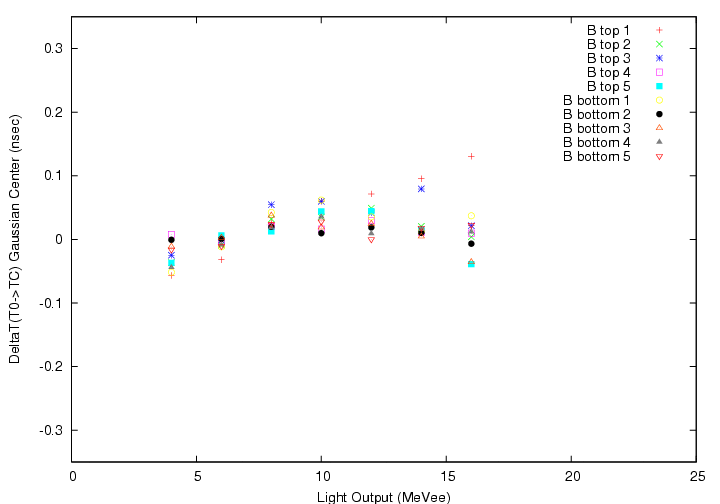
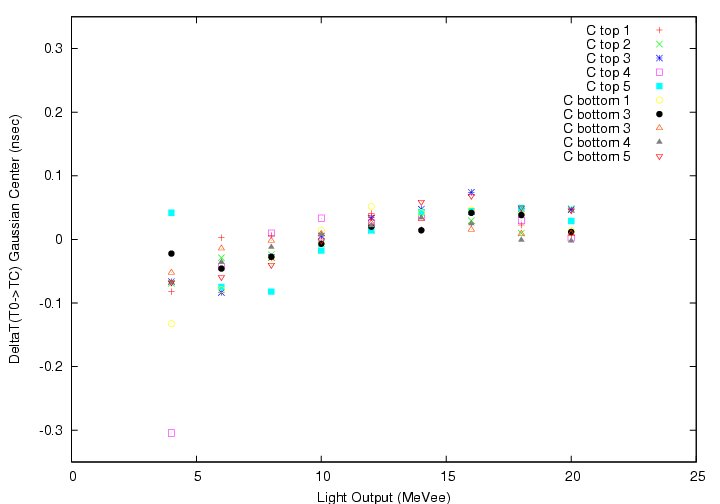
Segment-by-segment plot of the Gaussian center of DeltaT'(T0->TC_B)(top)/DeltaT'(T0->TC_C)(bottom) VS light output on TC, for run25 to run 306 (100% statistics). All production runs (run25-run306) have been accumulated.
Segment-by-segment plot of the Gaussian &sigma of DeltaT'(T0->TC_B)(top)/DeltaT'(T0->TC_C)(bottom) VS light output on TC for &gamma-ray. All production runs (run25-run306) have been accumulated.
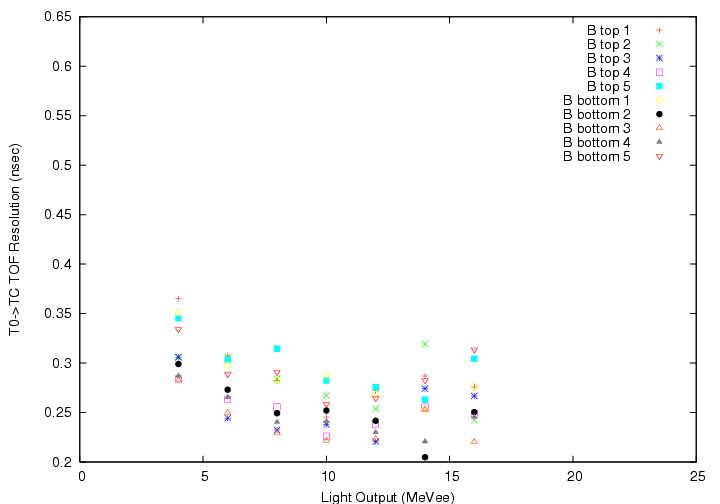
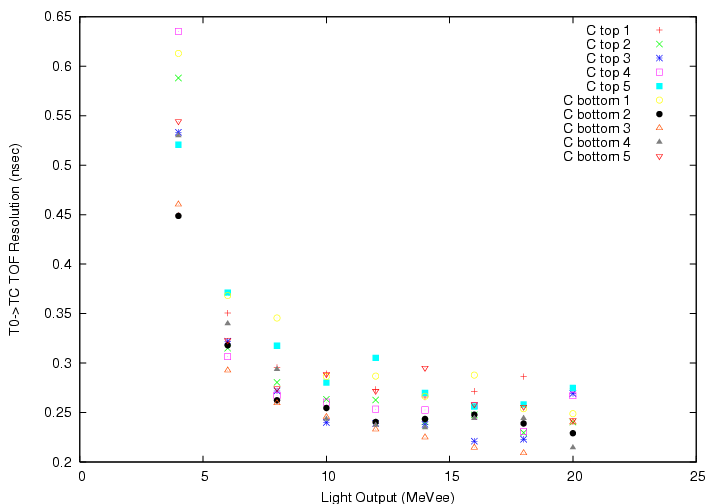
The resulting TOF resolution is about 250 psec equivalent for &gamma with MIP-equivalent light output, and dependence of the time origin on the light output is now moderate for both B and C.
1/&beta spectra for neutral/charged particles
Neutral particle spectra
Firstly, 1/&beta distribution for &gamma-ray are studied layer-by-layer.
Layer-by-layer plots of the variation of 1/&beta Gaussian center (top) and &sigma (bottom). Black/Red/Green/Yellow represent B_top/B_bottom/C_top/C_bottom, respectively. The TOF origin is stable within ~+- 30 psec, and the 1/&beta resolution is stable around 0.08 over 10 MeVee.
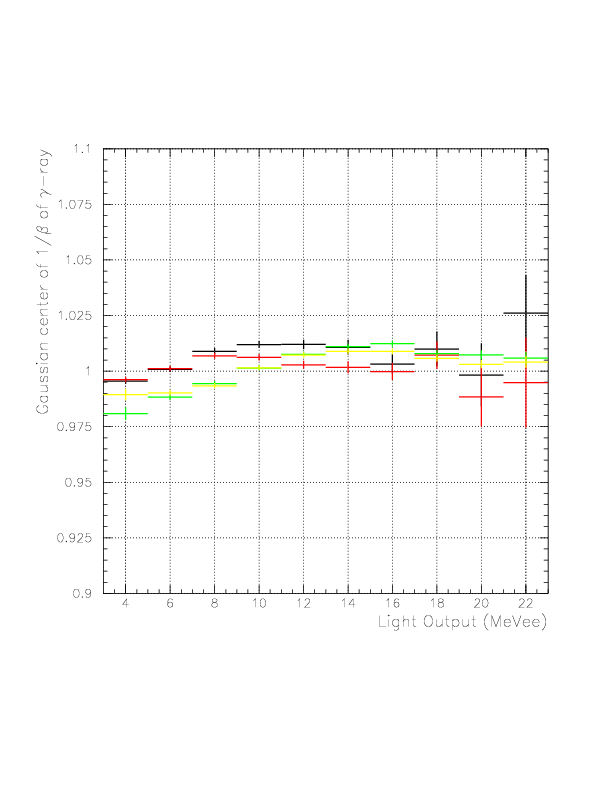
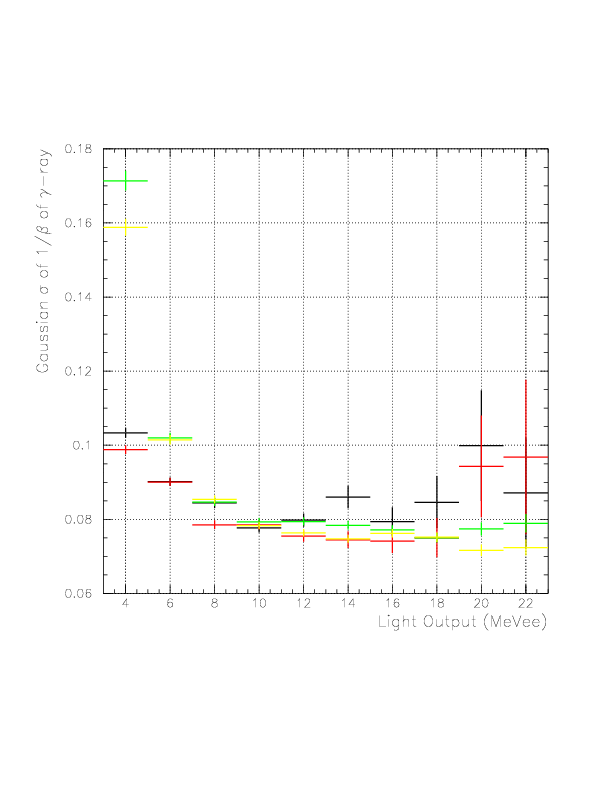
The performance of top/bottom layers are well-balanced, and B-layers are found to have fairly good resolution. Now, 1/&beta spectra of neutral particles detected on B/C layers are shown.
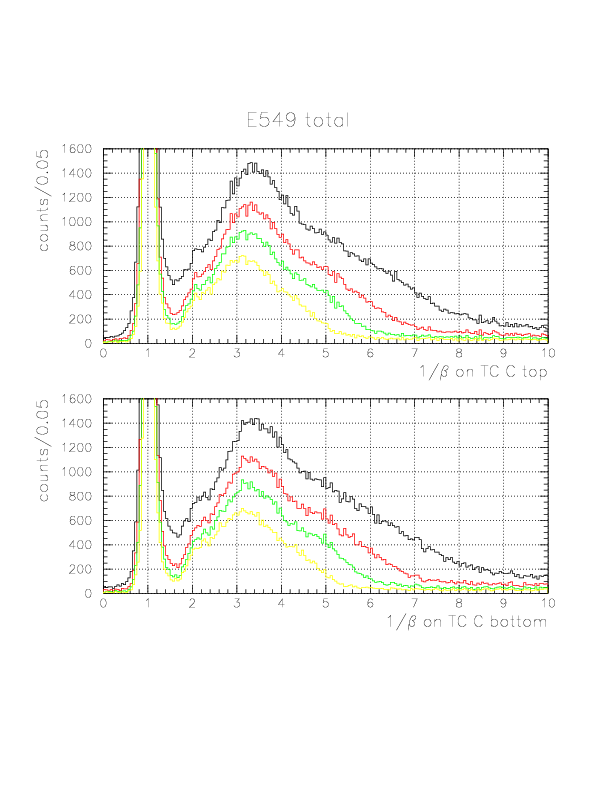
Global 1/&beta spectra of neutral particles on TC B top(top figure)/bottom(bottom figure) layers for software threshold values 3, 5, 7, and 10 MeVee.
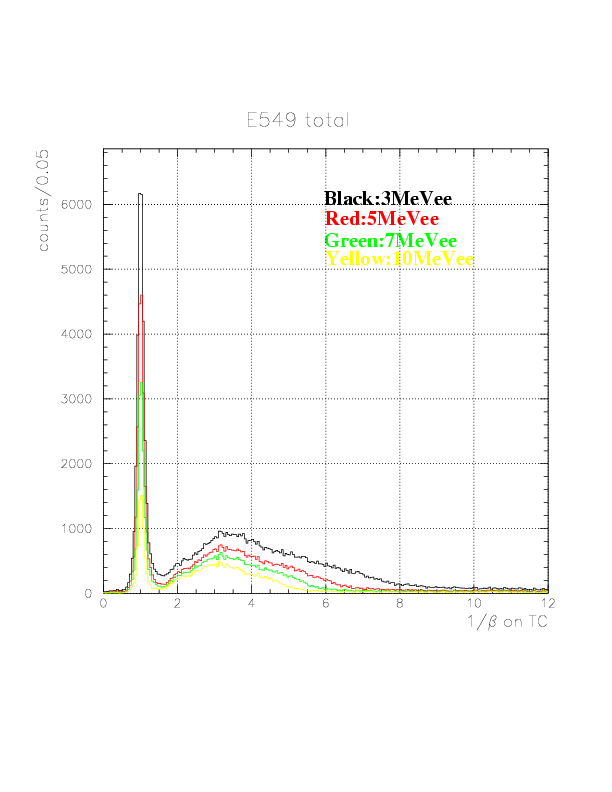
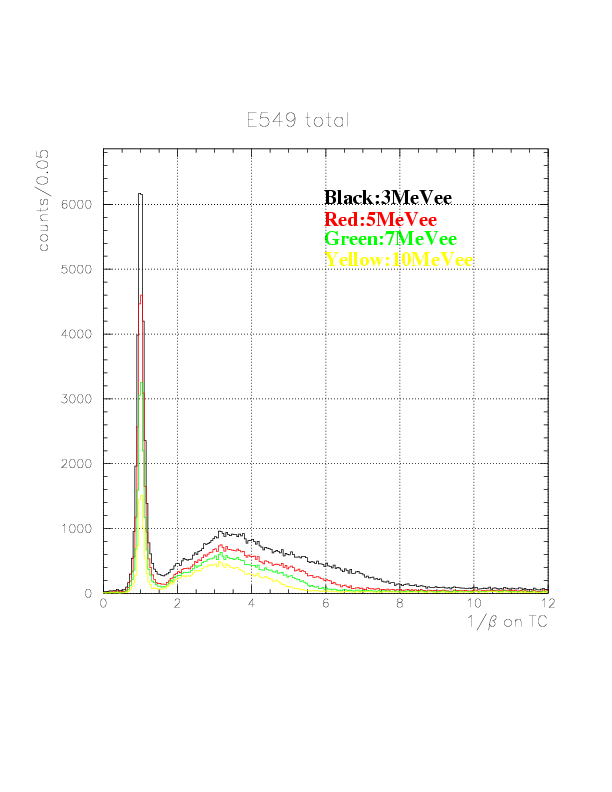
Global 1/&beta spectra of neutral particles on TC C top(top figure)/bottom(bottom figure) layers for software threshold values 3, 5, 7, and 10 MeVee.
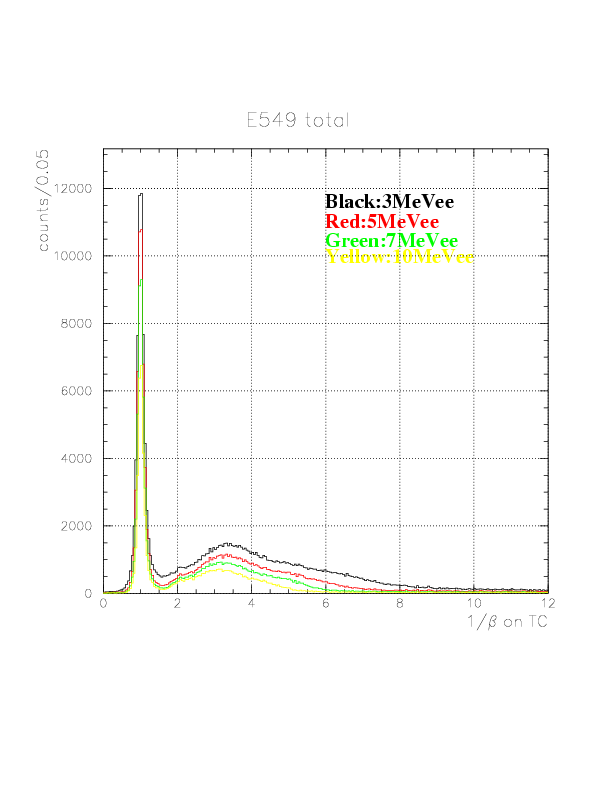
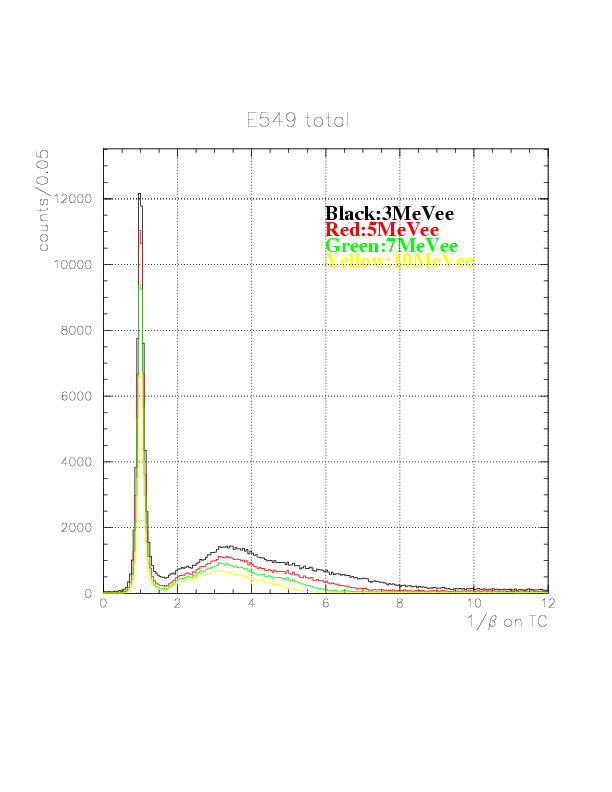
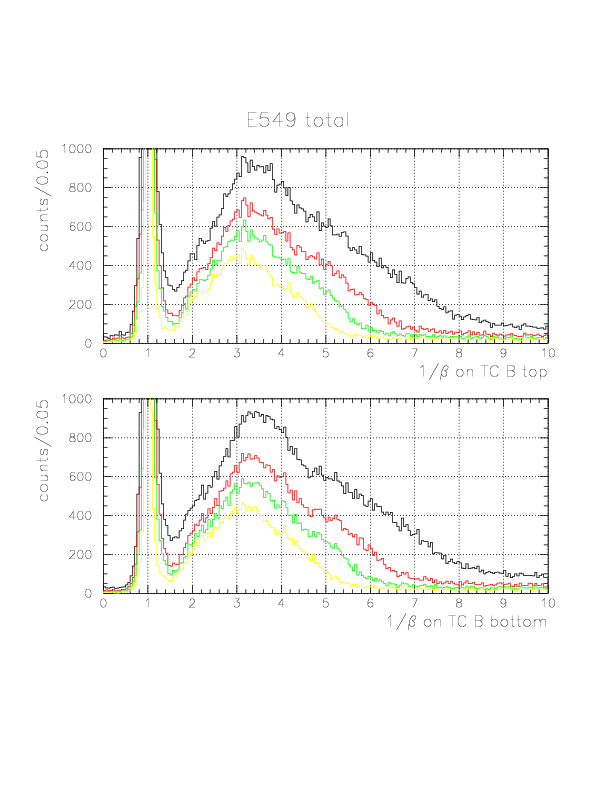
Local 1/&beta spectra of neutral particles on TC B(top)/C(bottom) under 3(black)/5(red)/7(green)/10(yellow) MeVee software threshold level. Note that constant BG level is substantially low compared to NT.
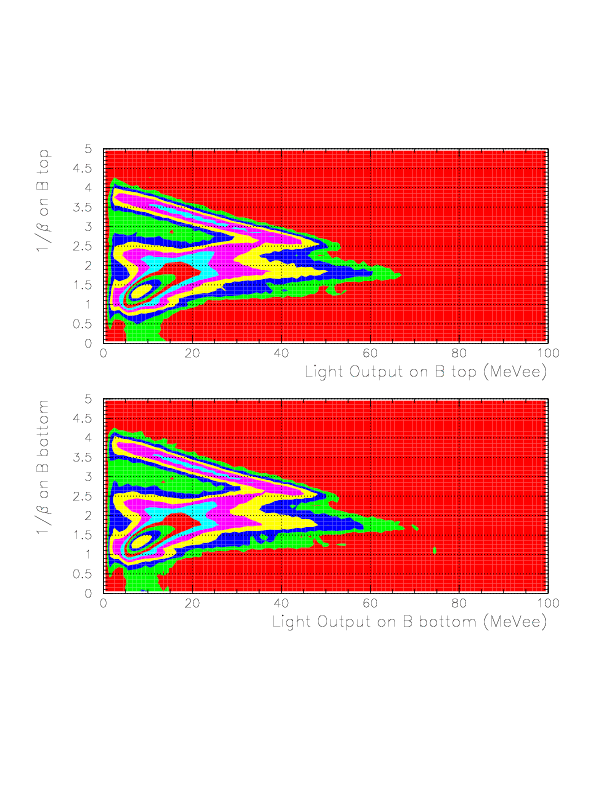
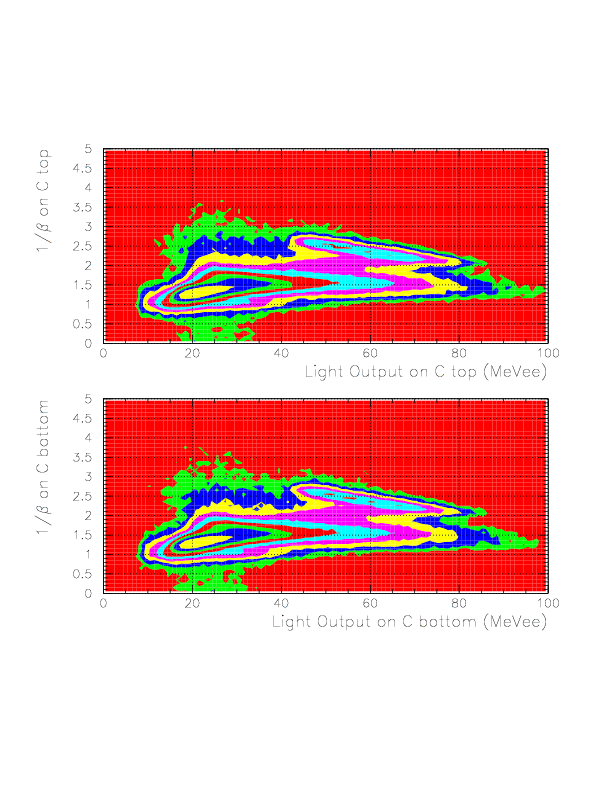
The correlation between 1/&beta (ordinate) and light output on B(top)/C(bottom) layers.
Charged particle spectra
Now, 1/&beta for TC-detected charged particle, X, is defined as follows:
TOF_X = Ttc_b' - Tt0 - TOFkstop(z),
Ttc_b' = Ttc_b - f(1/ph)*g(x) -const(idpart),
where TOF_X is the Time-Of-Flight of X. the functions f/g are adopted as they are defined by Compton-like &gamma-ray. Then, 1/&beta_X is defined as
1/&beta_X = c*TOF_X/L_TOF,
L_TOF = sqrt((TC_x-Vx)**2+(TC_y-Vy)**2+(TC_z-Vz)**2,
where TC_x, TC_y, and TC_z are defined by VDC at the inner-surface y position now.
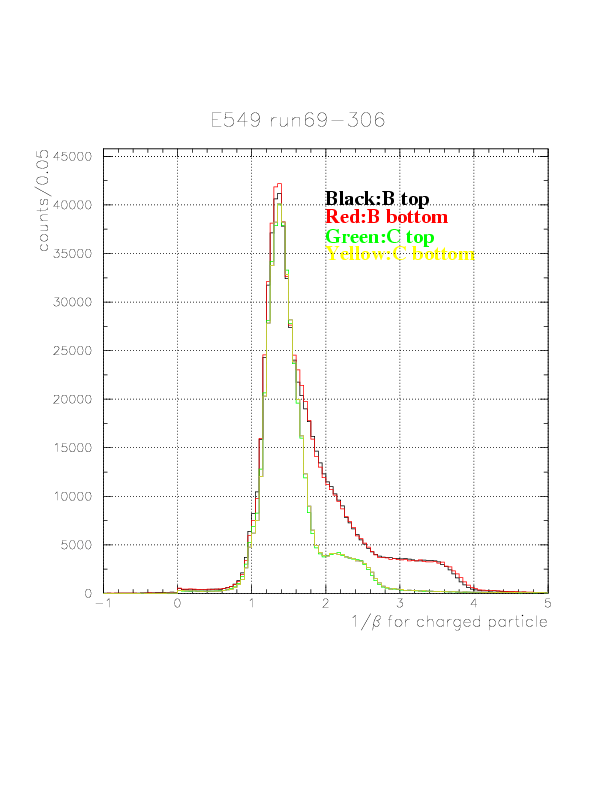
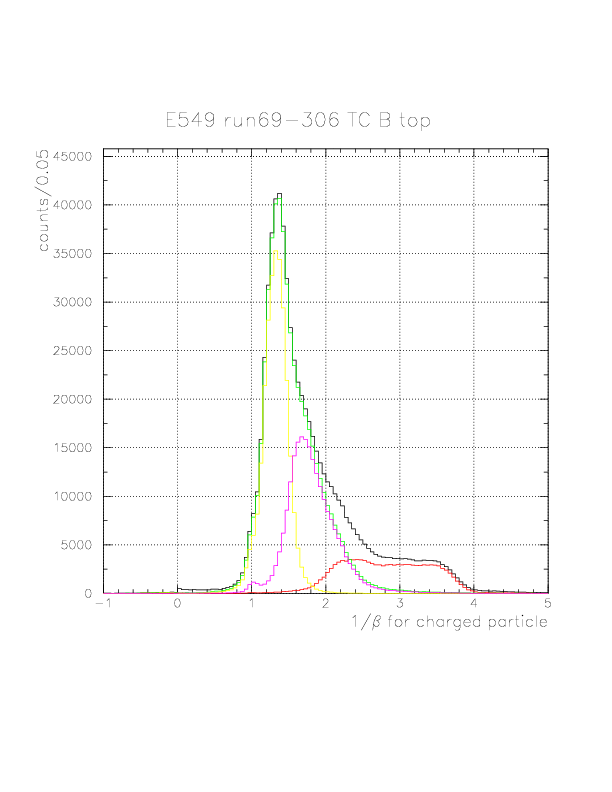
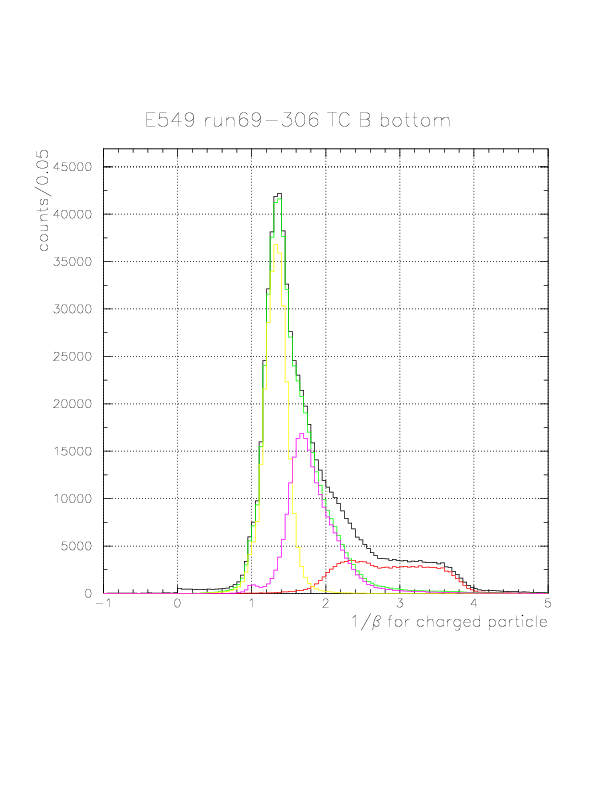
The layer-by-layer 1/&beta spectra and its decomposition to p/&pi components are shown below.
Segment-by-segment plot of 1/&beta for charged particles on B/C top/bottom layers. ID 1/2/3/4/5 are represented by black/red/green/yellow/magenta colors, respectively.
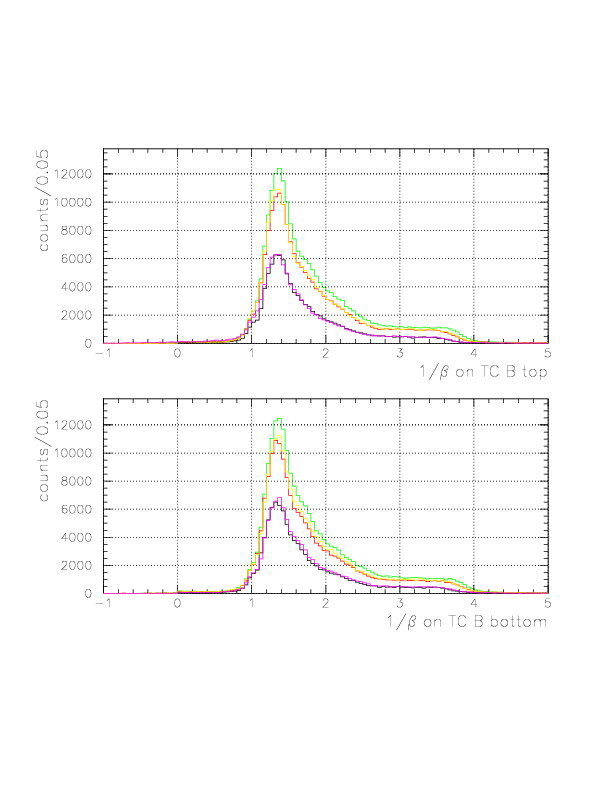
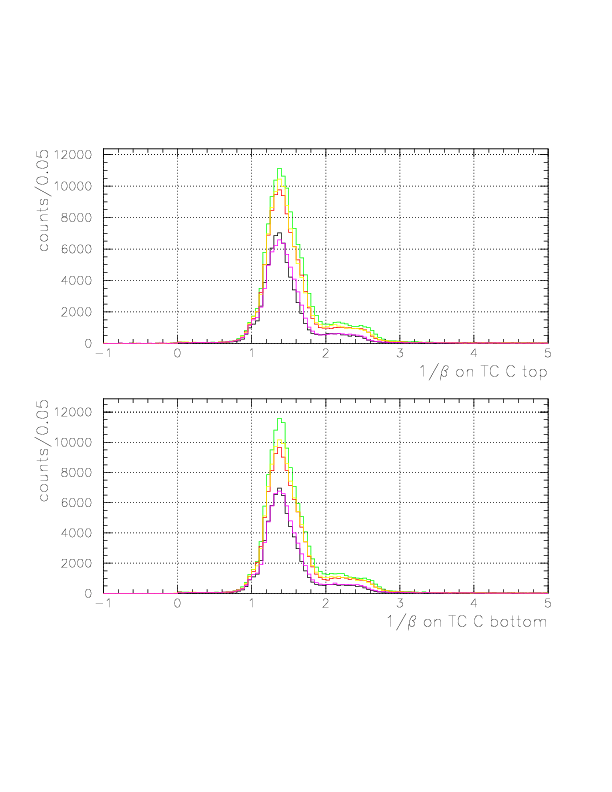
The comparison of 1/&beta spectra detected on B/C layers.
The 1/&beta spectra for all(black)/p(red)/&pi(green)/fast&pi(yellow)/slow&pi(magenta) events on TC B layer.
The 1/&beta spectra for all(black)/p(red)/&pi(green)/fast&pi(yellow)/slow&pi(magenta) events on TC C layer.
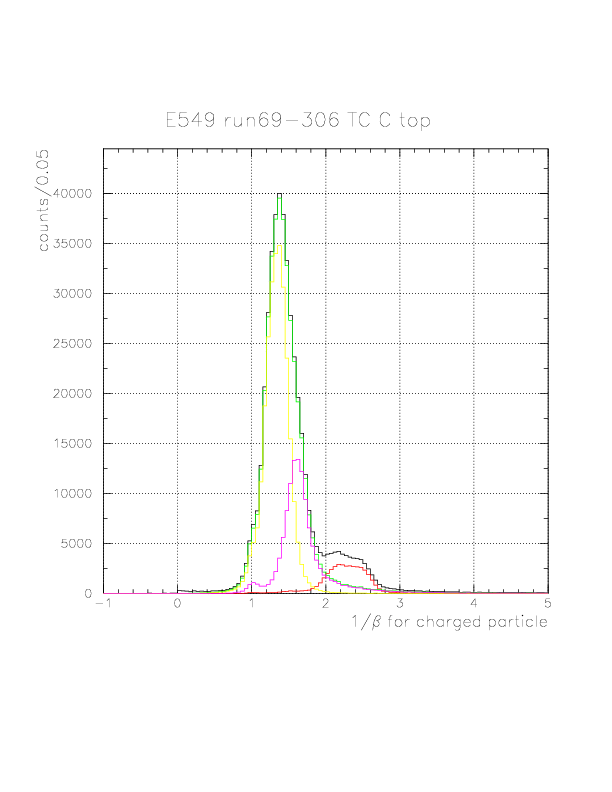
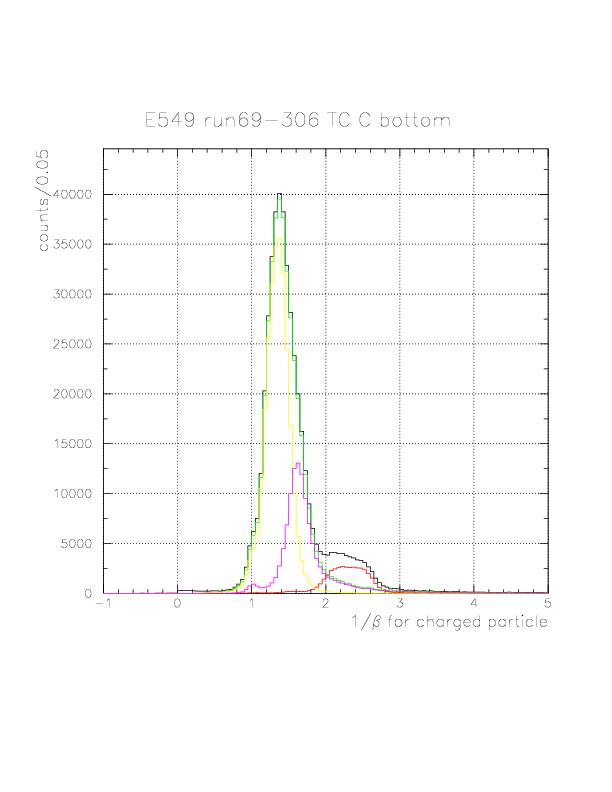
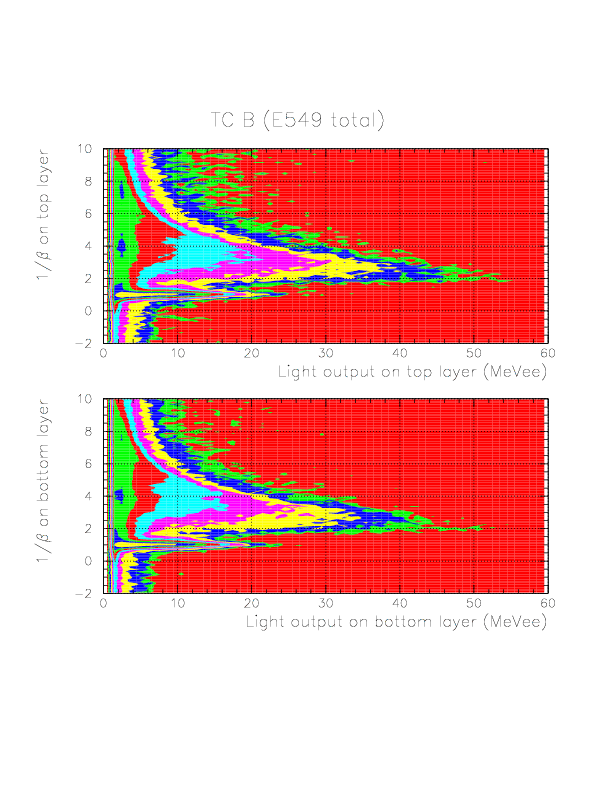
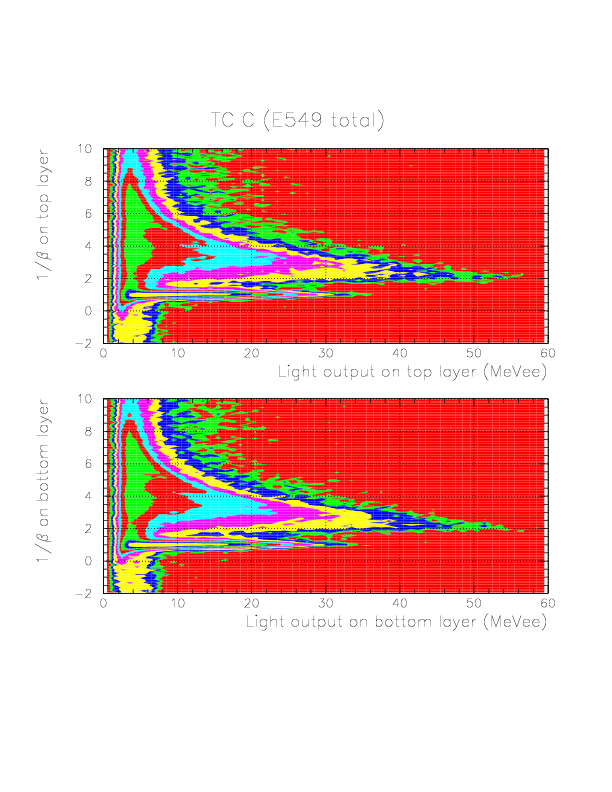
Layer-by-layer 2D-plots between 1/&beta and Light output are shown below.
Layer-by-layer correlation between 1/&beta and Light output on TC B(top)/C(bottom) layers.
TOF analysis of A-layer
Until now, we postponed the A-layer TOF analysis, since we have no way to tune
the slewing correction functions/offset parameters. Here, we try to finalize the A-layer TOF analysis, then E549 100% statistics would be available with TC information (it is already known that a large jump of the TOF origin exist between run 66 and 69, hence TC PID does not work before run69 without a fine tune of A-layer).
Method
We just tune A-layer correction function/part-by-part parameters, by studying
DeltaT(TC_A->TC_B) = Ttc_b' - Ttc_a - TOF(TC_A->TC_B),
where
Ttc_b' = Ttc_b - f(1/ph)*g(x) -const(idpart),
Ttc_a = (Ttc_a_L + Ttc_a_R)/2,
and
TOF(TC_A->TC_B) = 1/&beta * L(TC_A->TC_B)/c,
for charged events. 1/&beta is now just determined with T0->TC_B TOF analysis
as described previously.
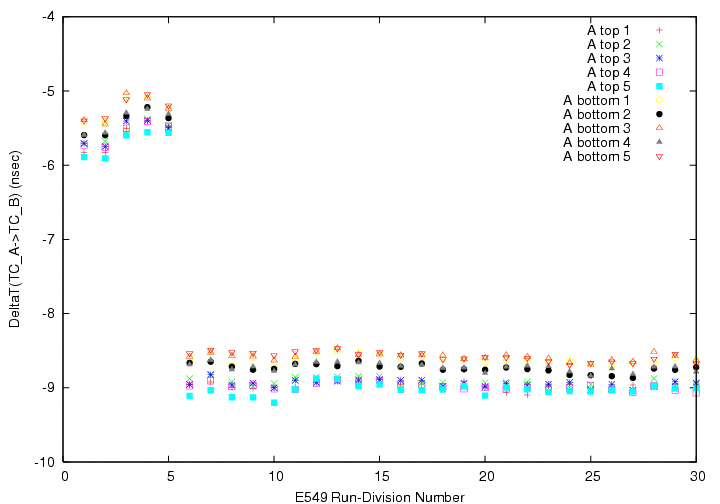
Firstly, we study the run-part-dependence of the DeltaT(TC_A->TC_B).
The segment-by-segment run dependence of the DeltaT(TC_A->TC_B).
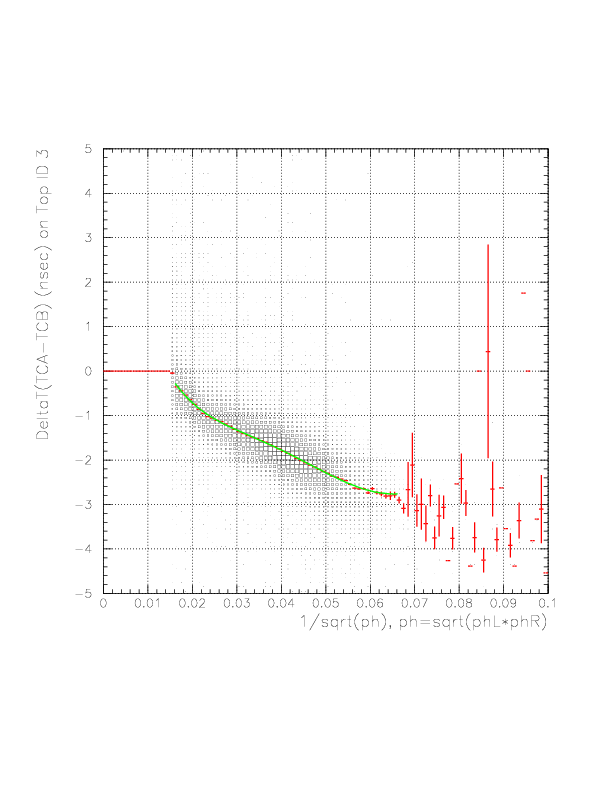
Secondly, after the subtraction of the observed run-dependence, we study f(1/sqrt(ph)) and g(x) with charged particle (p/&pi^+-). Here,we adopt 5th order polinomial as f().
The correlation between 1/sqrt(ph) (horizontal) and DeltaT(TC_A->TC_B) (vertical) on top ID 3.
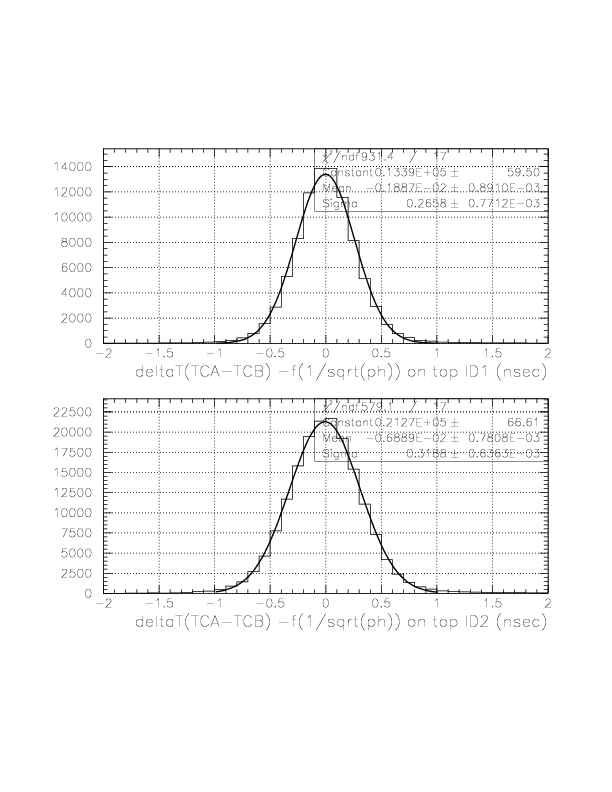
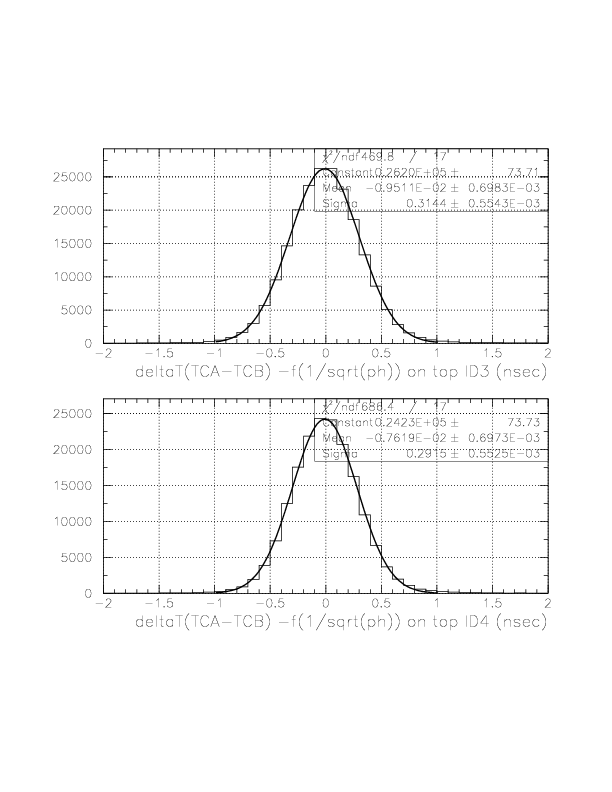
The Gaussian center and width of all 10 A-B combinations after f(1/sqrt(ph)) correction.
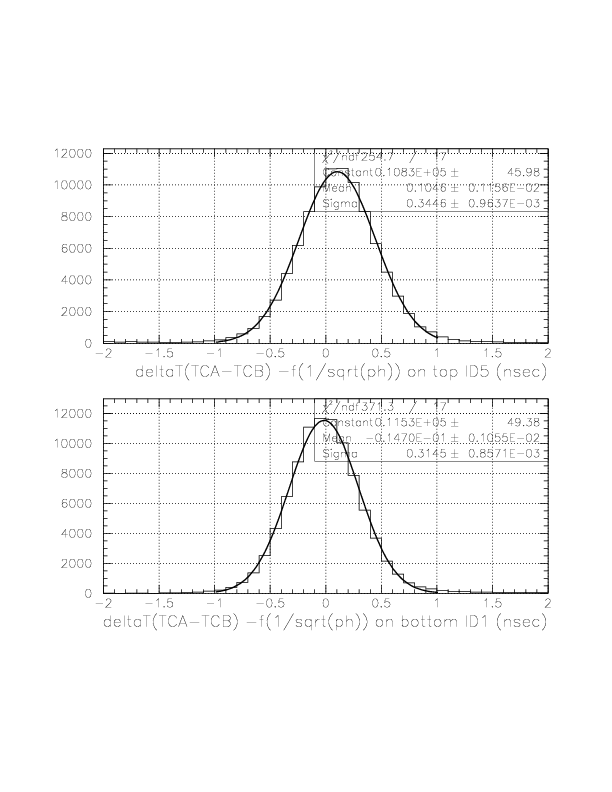
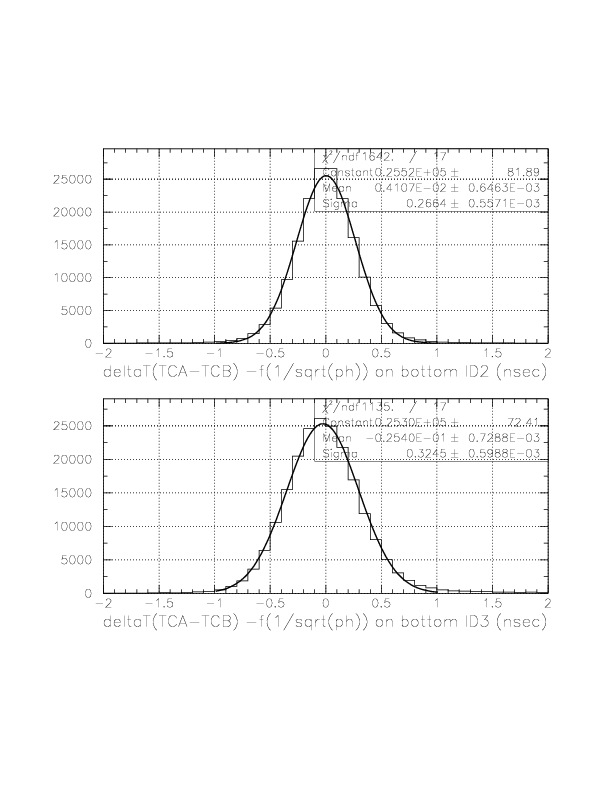
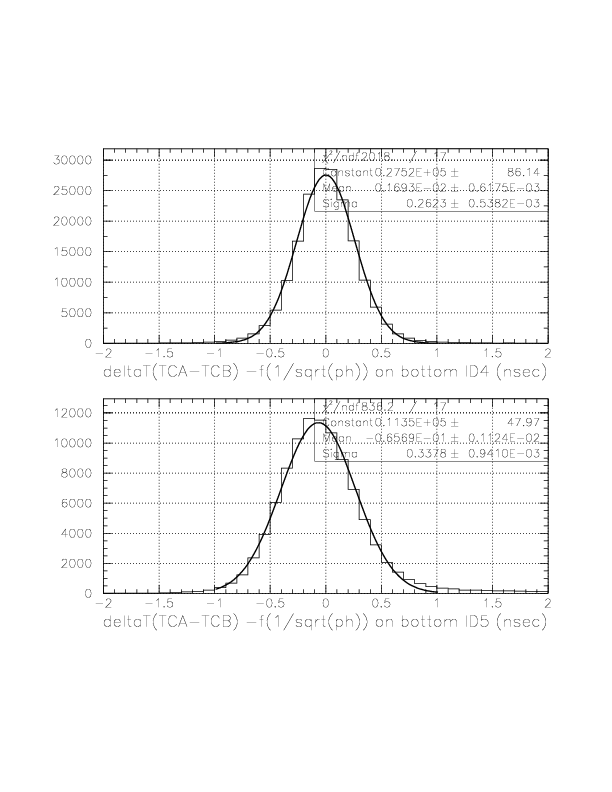
Thirdly, we study g(x). As already done for B/C layers, we study the distribution of the quantity,
DeltaT(TC_A->TC_B) - f(1/sqrt(ph)) -const(idpart) = f(1/sqrt(ph))*(g(x)-1.),
with respect to x on TC.
The correlation between time residual after f(1/sqrt(ph)) correction (horizontal) and x on TC (vertical).
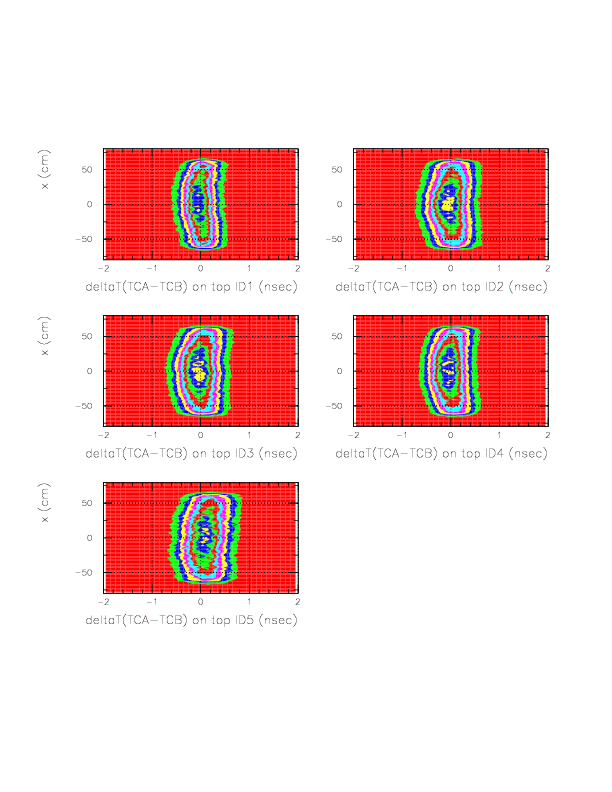
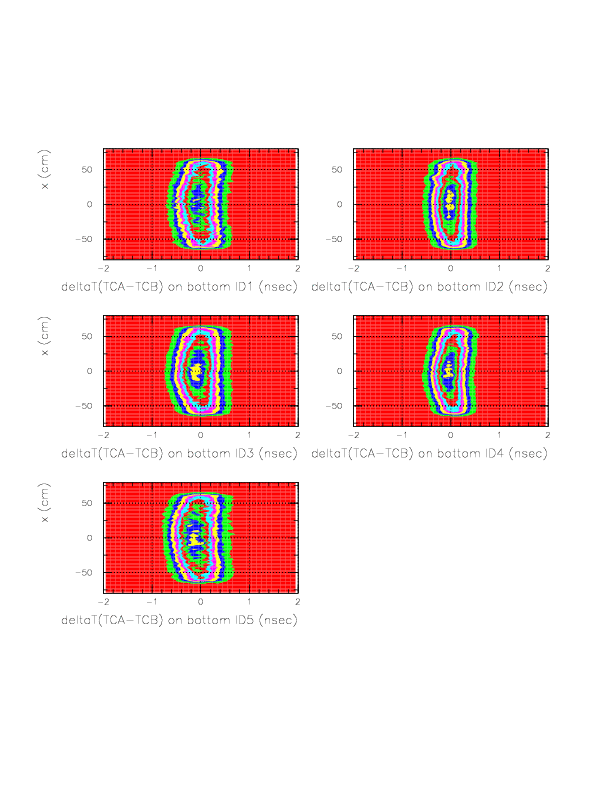
Then, g(x) can be obtained. The resulting distribution ofDeltaT(TC_A->TC_B) - f(1/sqrt(ph))*g(x) -const(idpart)is shown below. The x-dependence has vanished.
The correlation between time residual after f(1/sqrt(ph))*g(x) correction (horizontal) and x on TC (vertical).
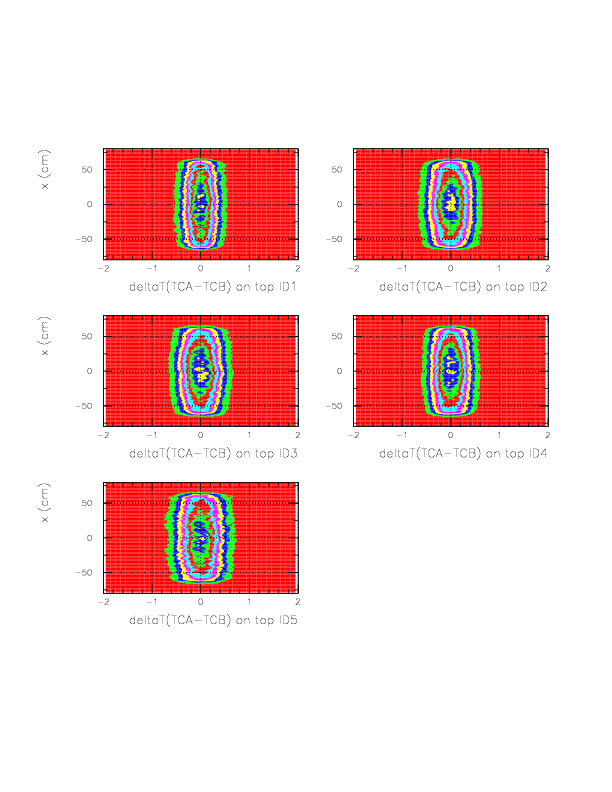
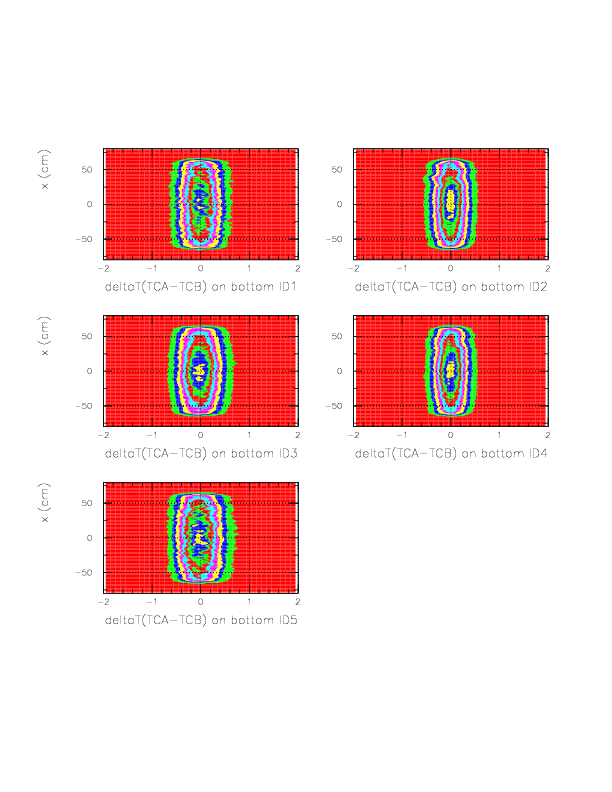
Therefore, we define the stop timing on TC_A, as
T(TC_A) = Ttc_a + f(1/sqrt(ph))*g(x) + const(idpart),
by adopting f(1/sqrt(ph)),g(x), and const(idpart) obtained. Then, 1/&beta on TC_A can be defined as
1/&beta(T0->TC_A) = (T(TC_A) - Tt0 - TOFkstop(z))*c/L_TOF,
and now 1/&beta on TC_A is well-defined for the all of the production runs.
Upgraded PID definition on A-layer
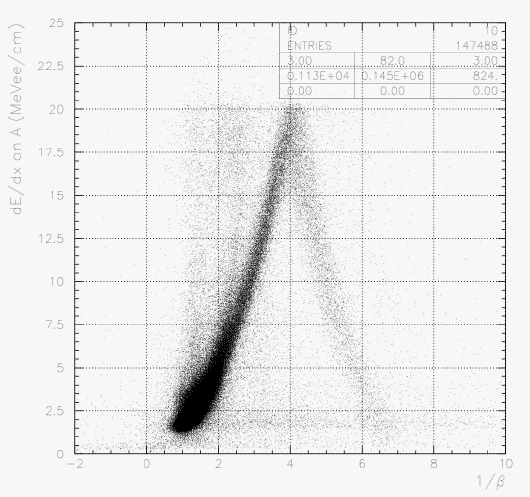
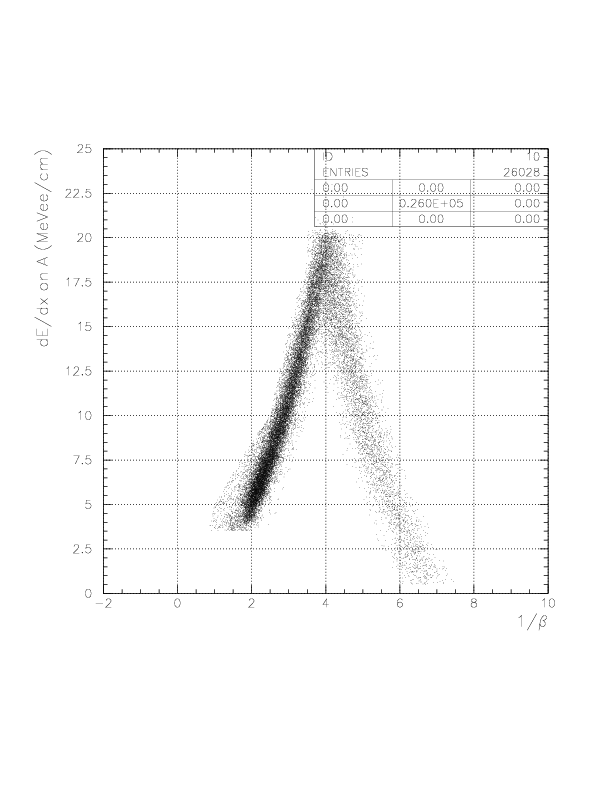
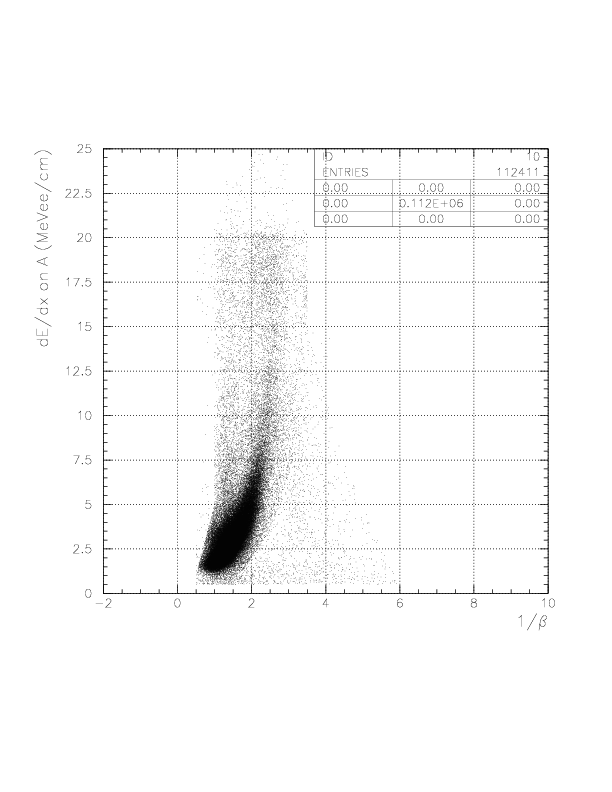
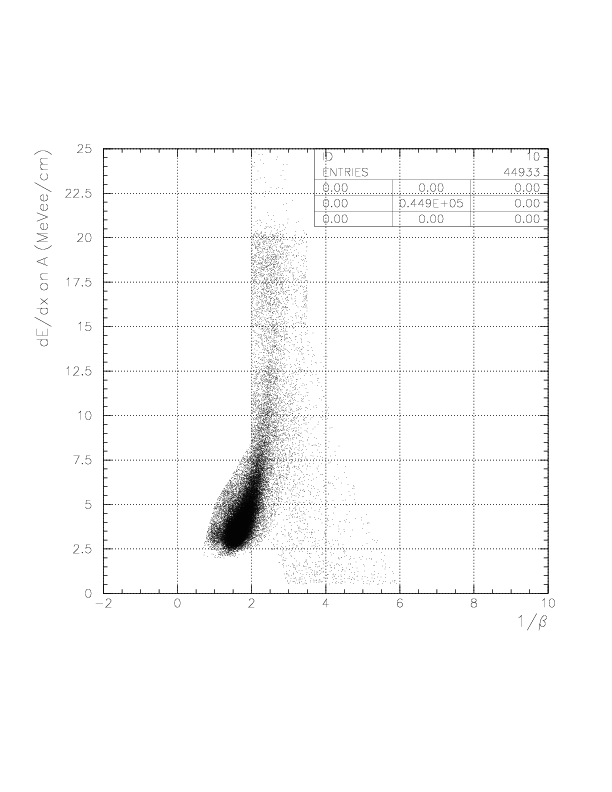
Since A layer TOF tune was not well done before the termination of B/C layer TOF analysis, the PID definition on A layer was incomplete. Due to a sudden jump of A layer time origin after run66, TC PID did not work for run25~66 until now. Therefore, now we finalize the A-layer PID, hence E549 100% statistics will be available with TC PID/TOF information. We just define the polygone again, on the correlation between dE/dx on A and 1/&beta measured by T0-TC_A.
As already described here, the events with VDCtrack(hence A layer hit) are initially classified with the hit condition on B-layer:
Event set 1. B layer is not fired.
Event set 2. B layer is fired.
Then, set 1 and 2 are classified graphically by the 2D correlation between
1/&beta (T0->TC_A) and dE/dx (on A), as shown below. The physical contents of the selection (a)~(g) are just kept as defined before, but now better resolution and stability have been achieved from run25 up tp run306 due to the presence of nice calibration procedure.
1/&beta VS dE/dx on A if B is not fired.
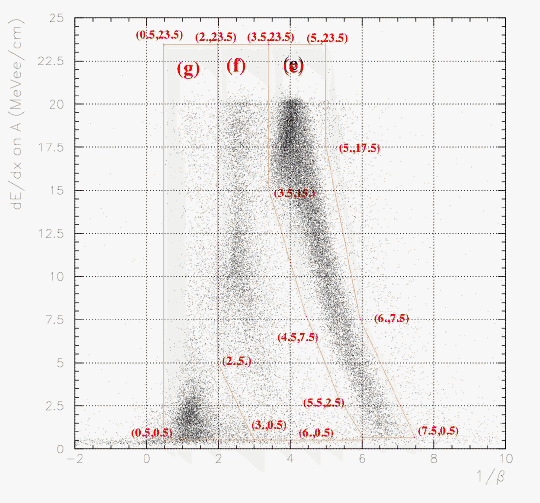
1/&beta VS dE/dx on A if B is fired.
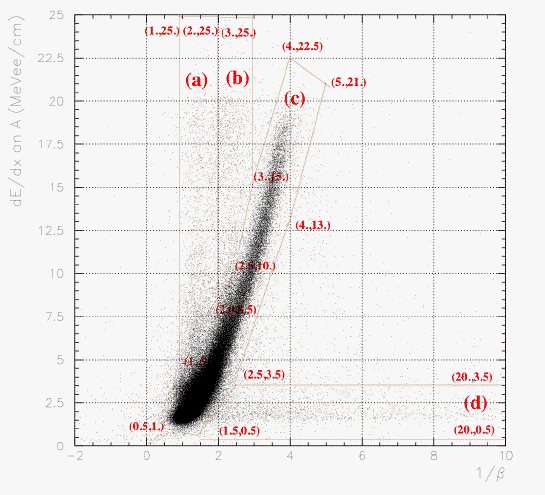
From the first to fifth, 1/&beta VS dE/dx on A for 'semi-inclusive','p','&pi','slow&pi' and 'fast&pi' events on TCtop, respectively. Note that the entry number ratio represents the event number ratio.
