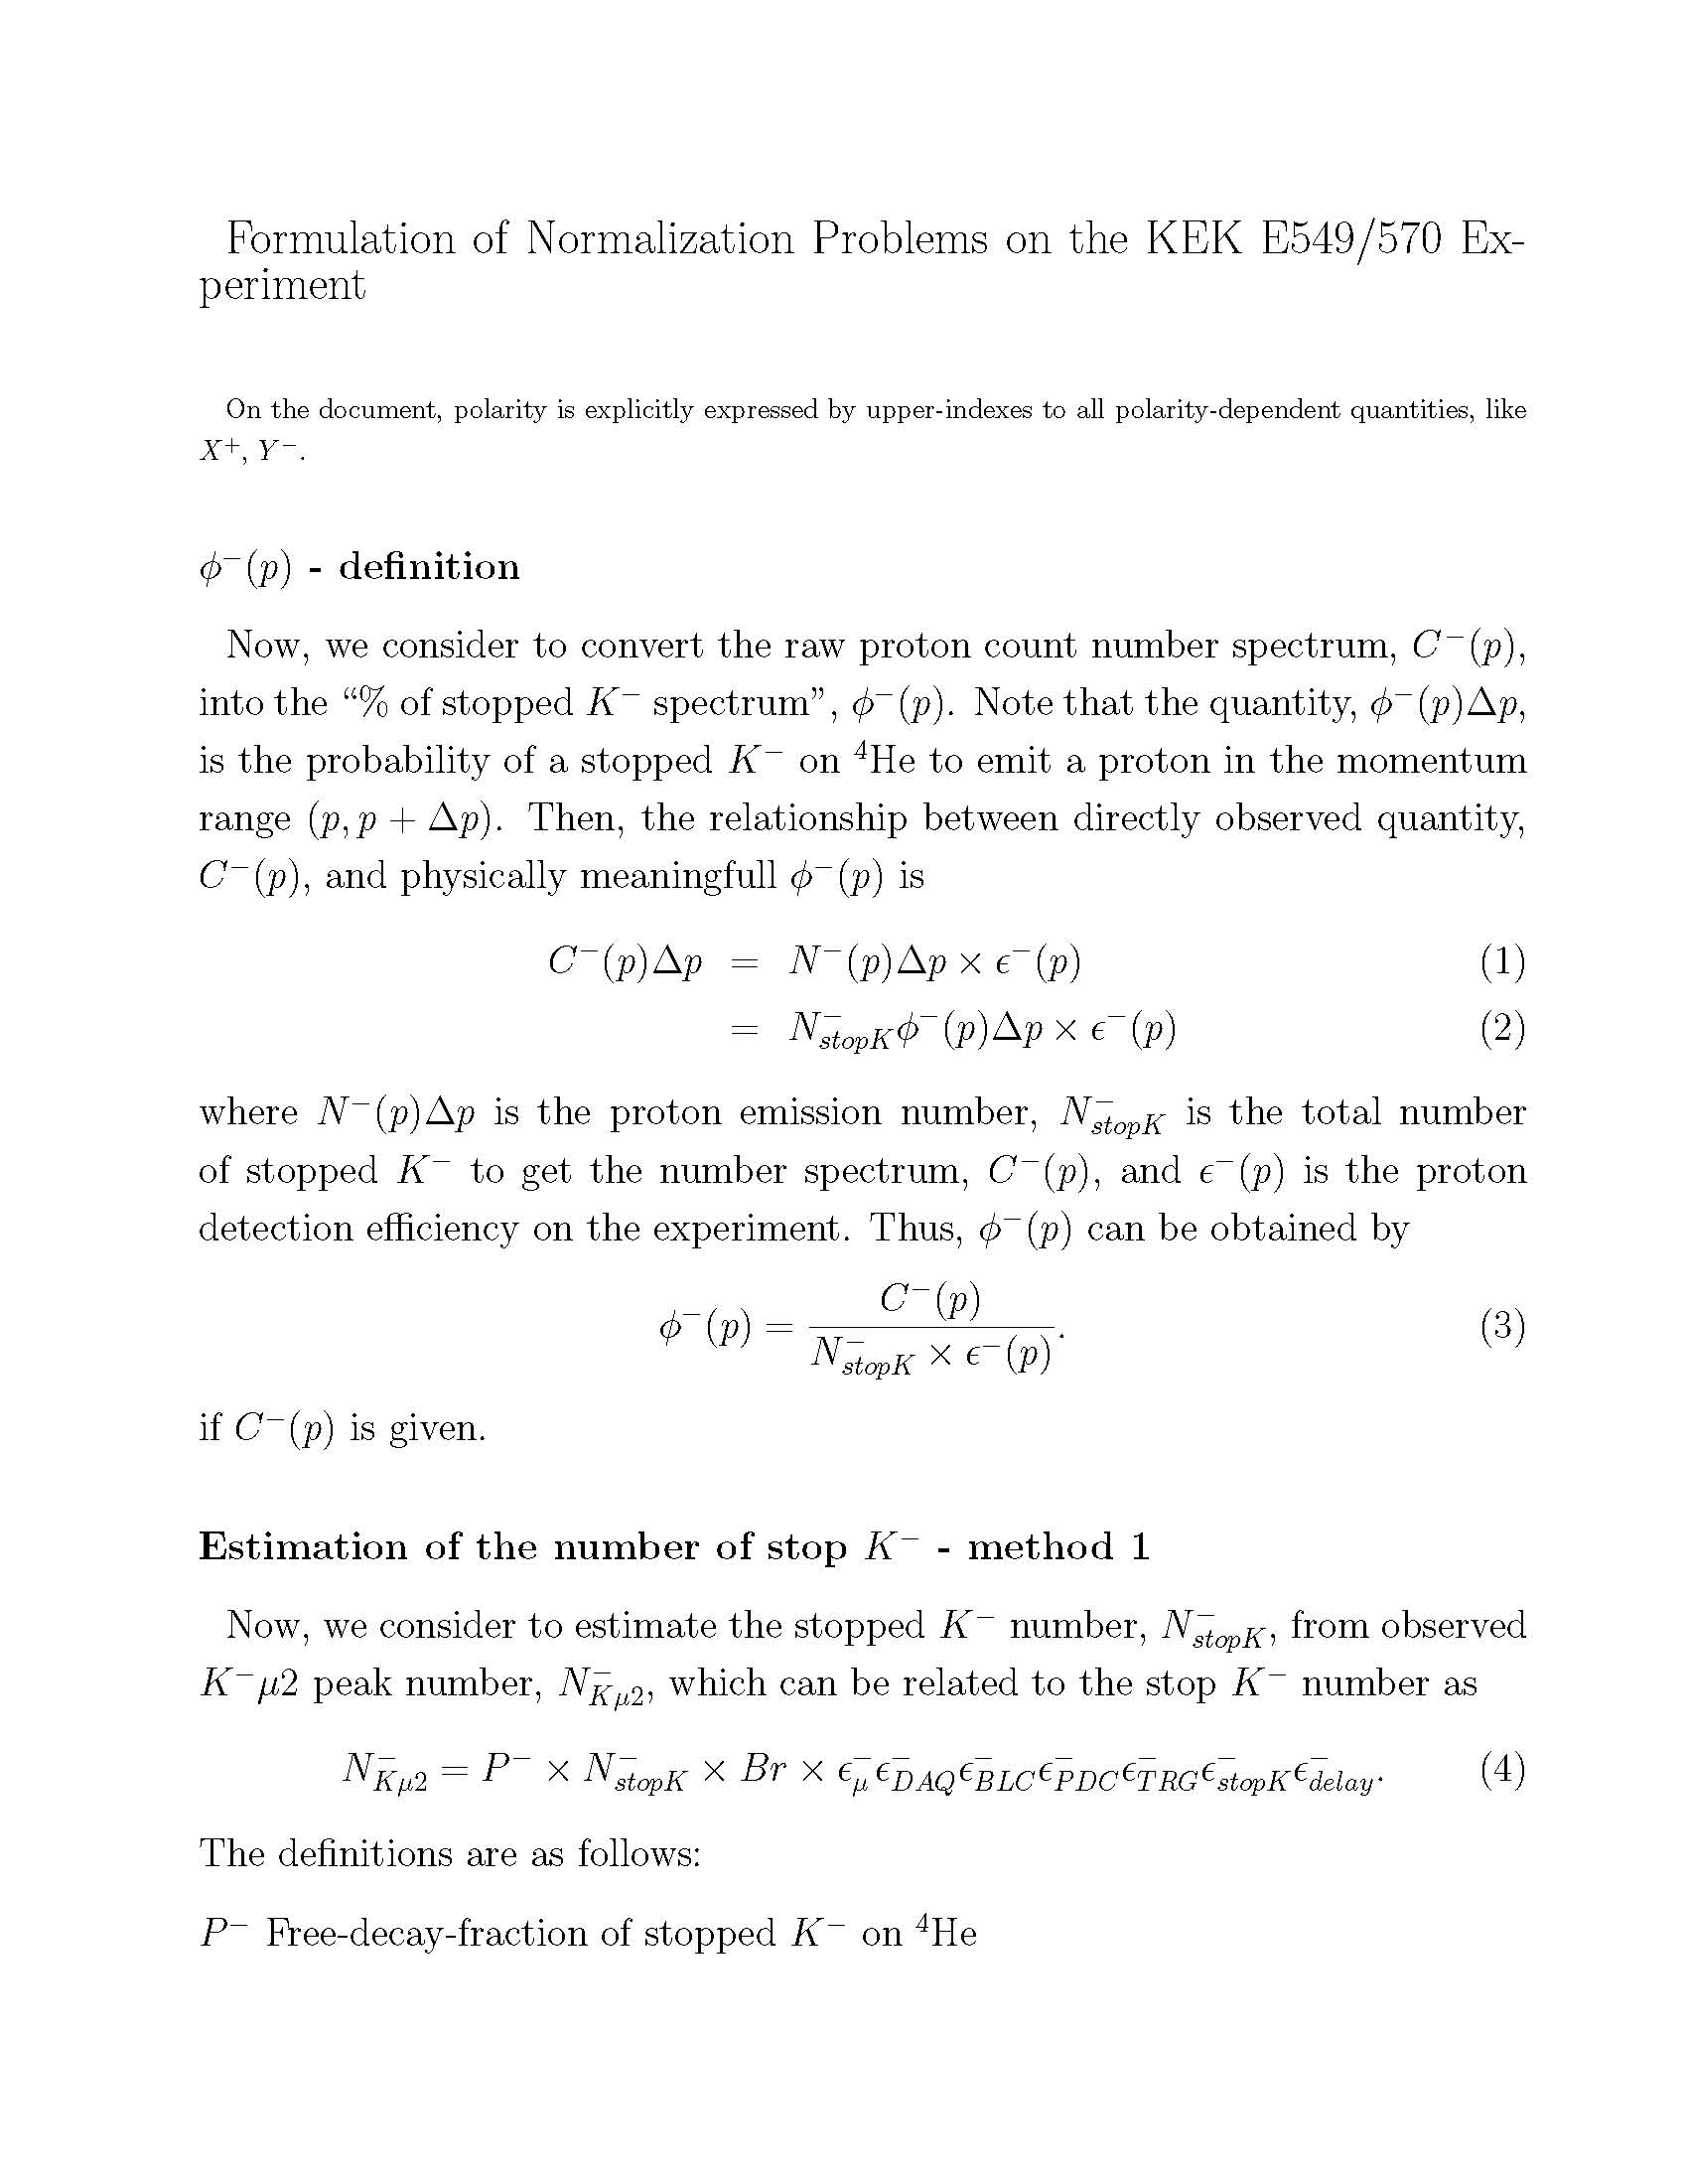
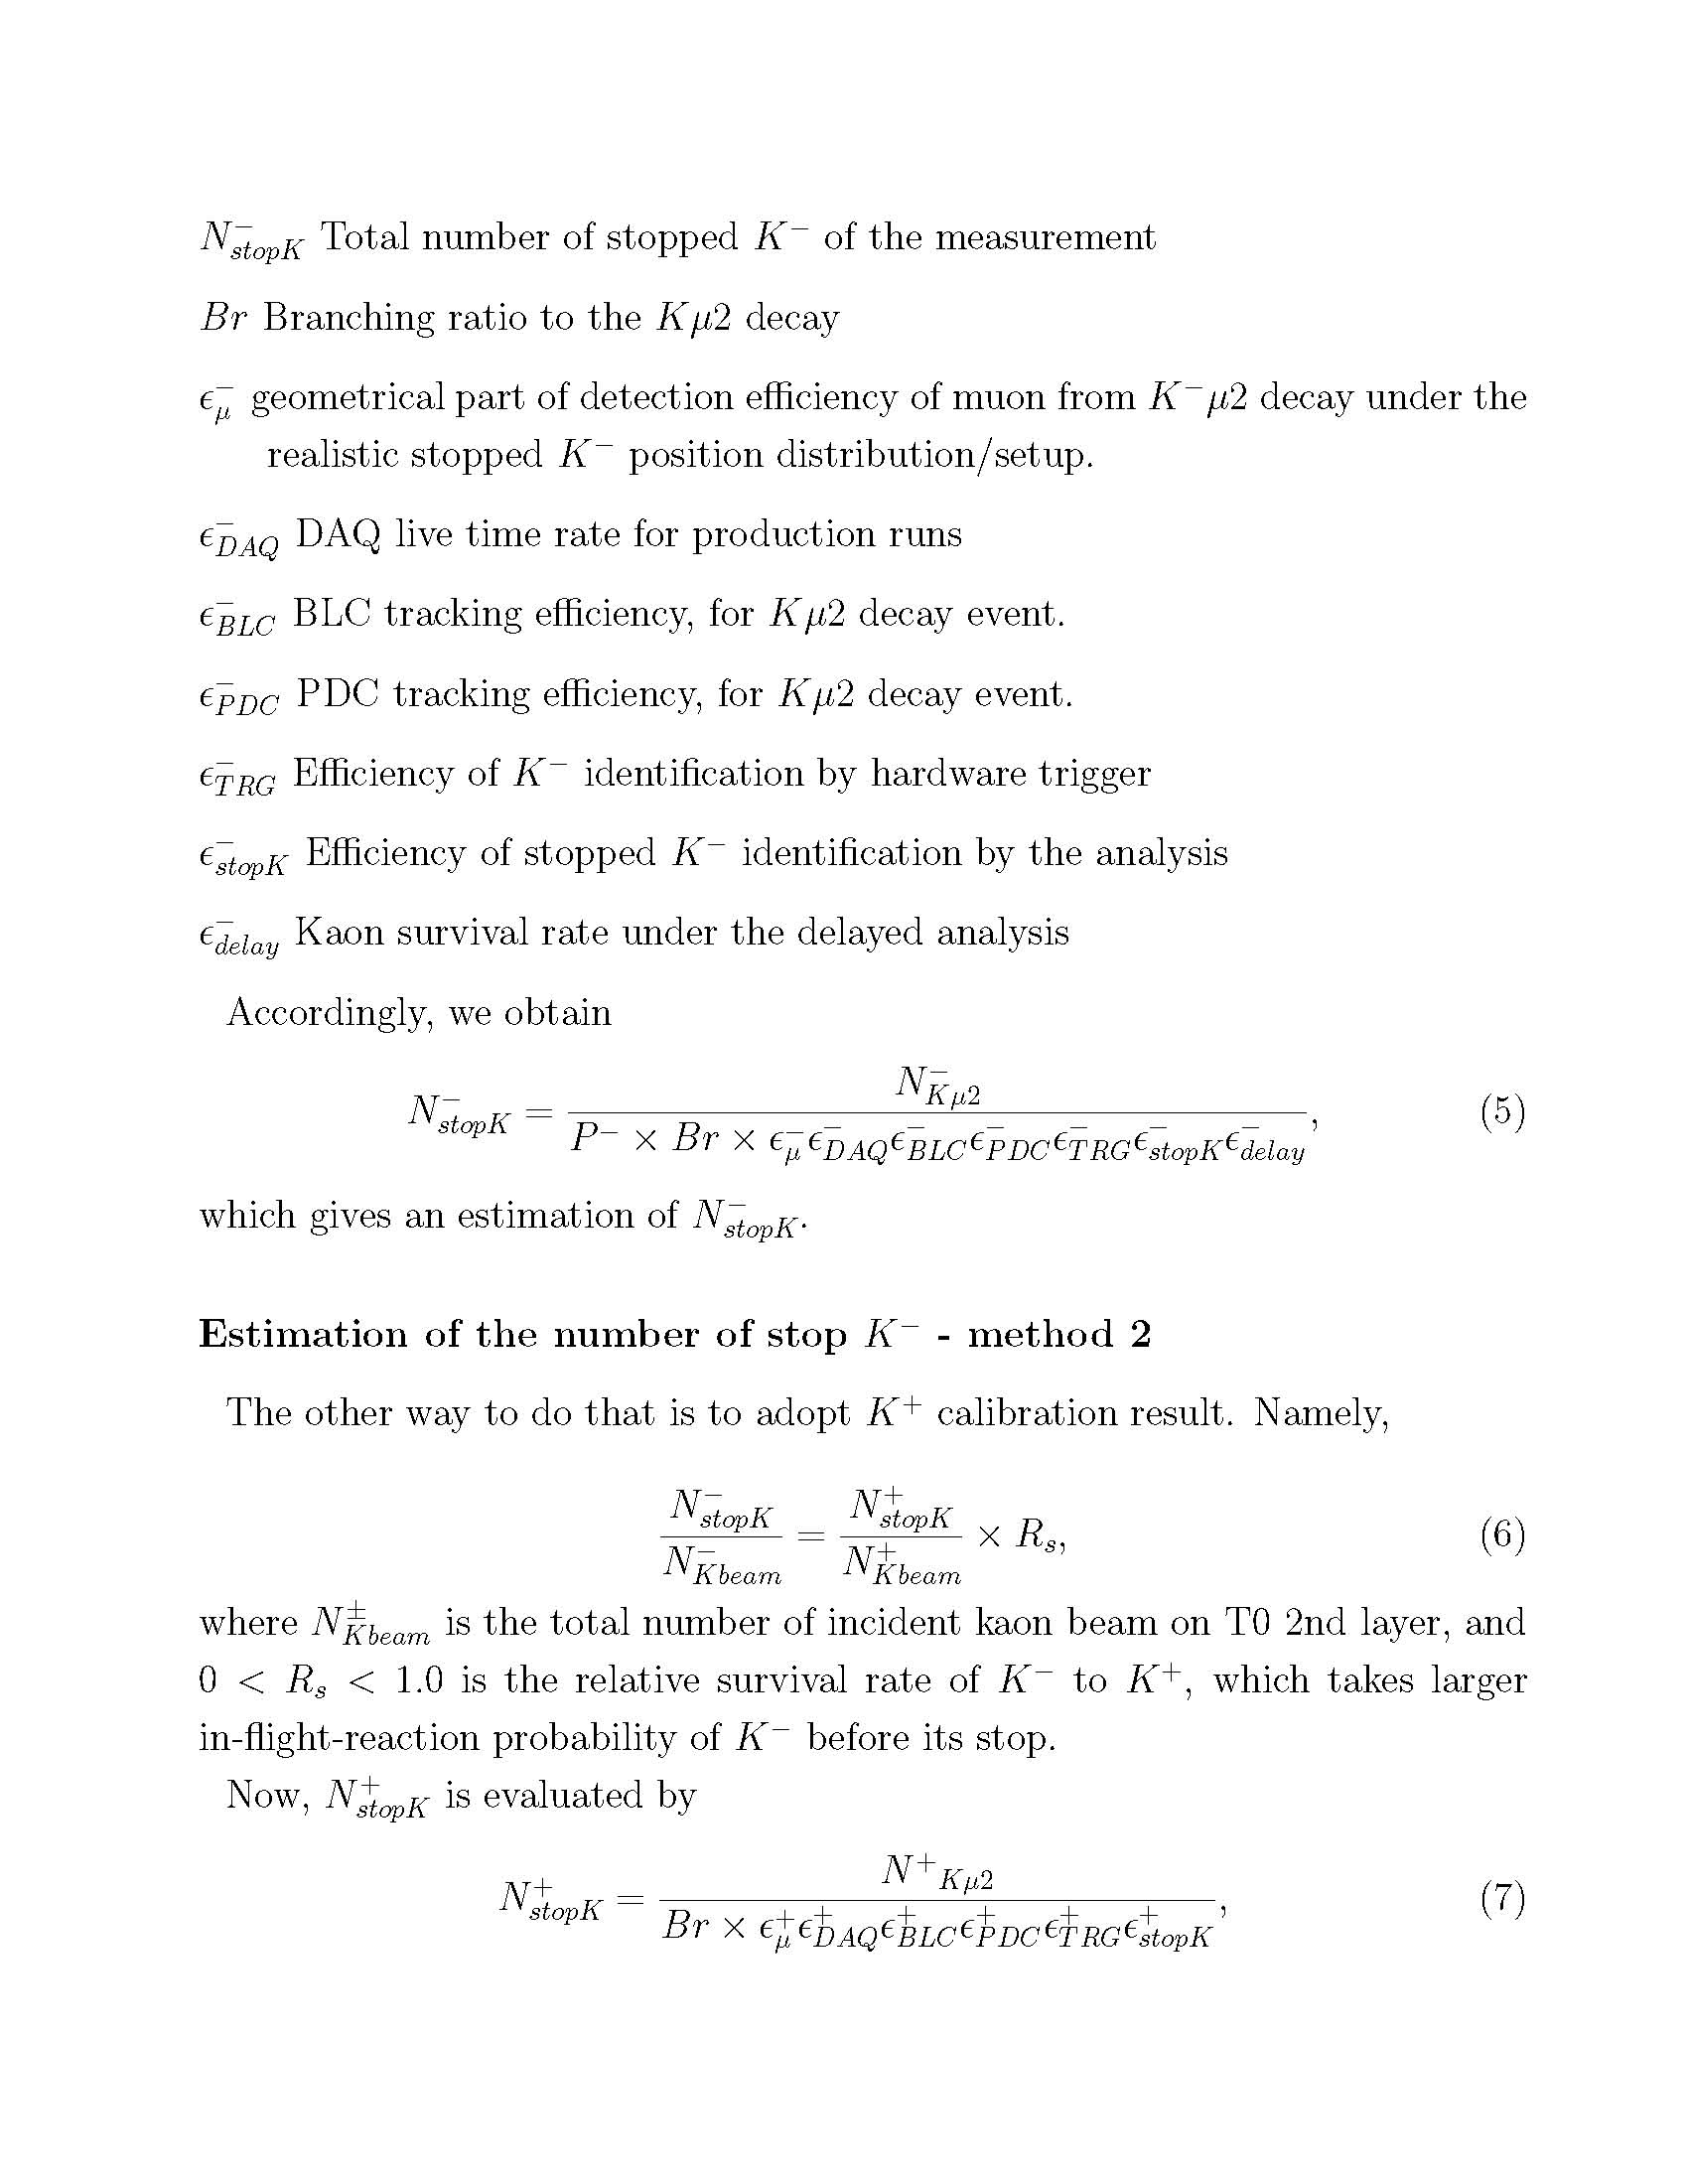
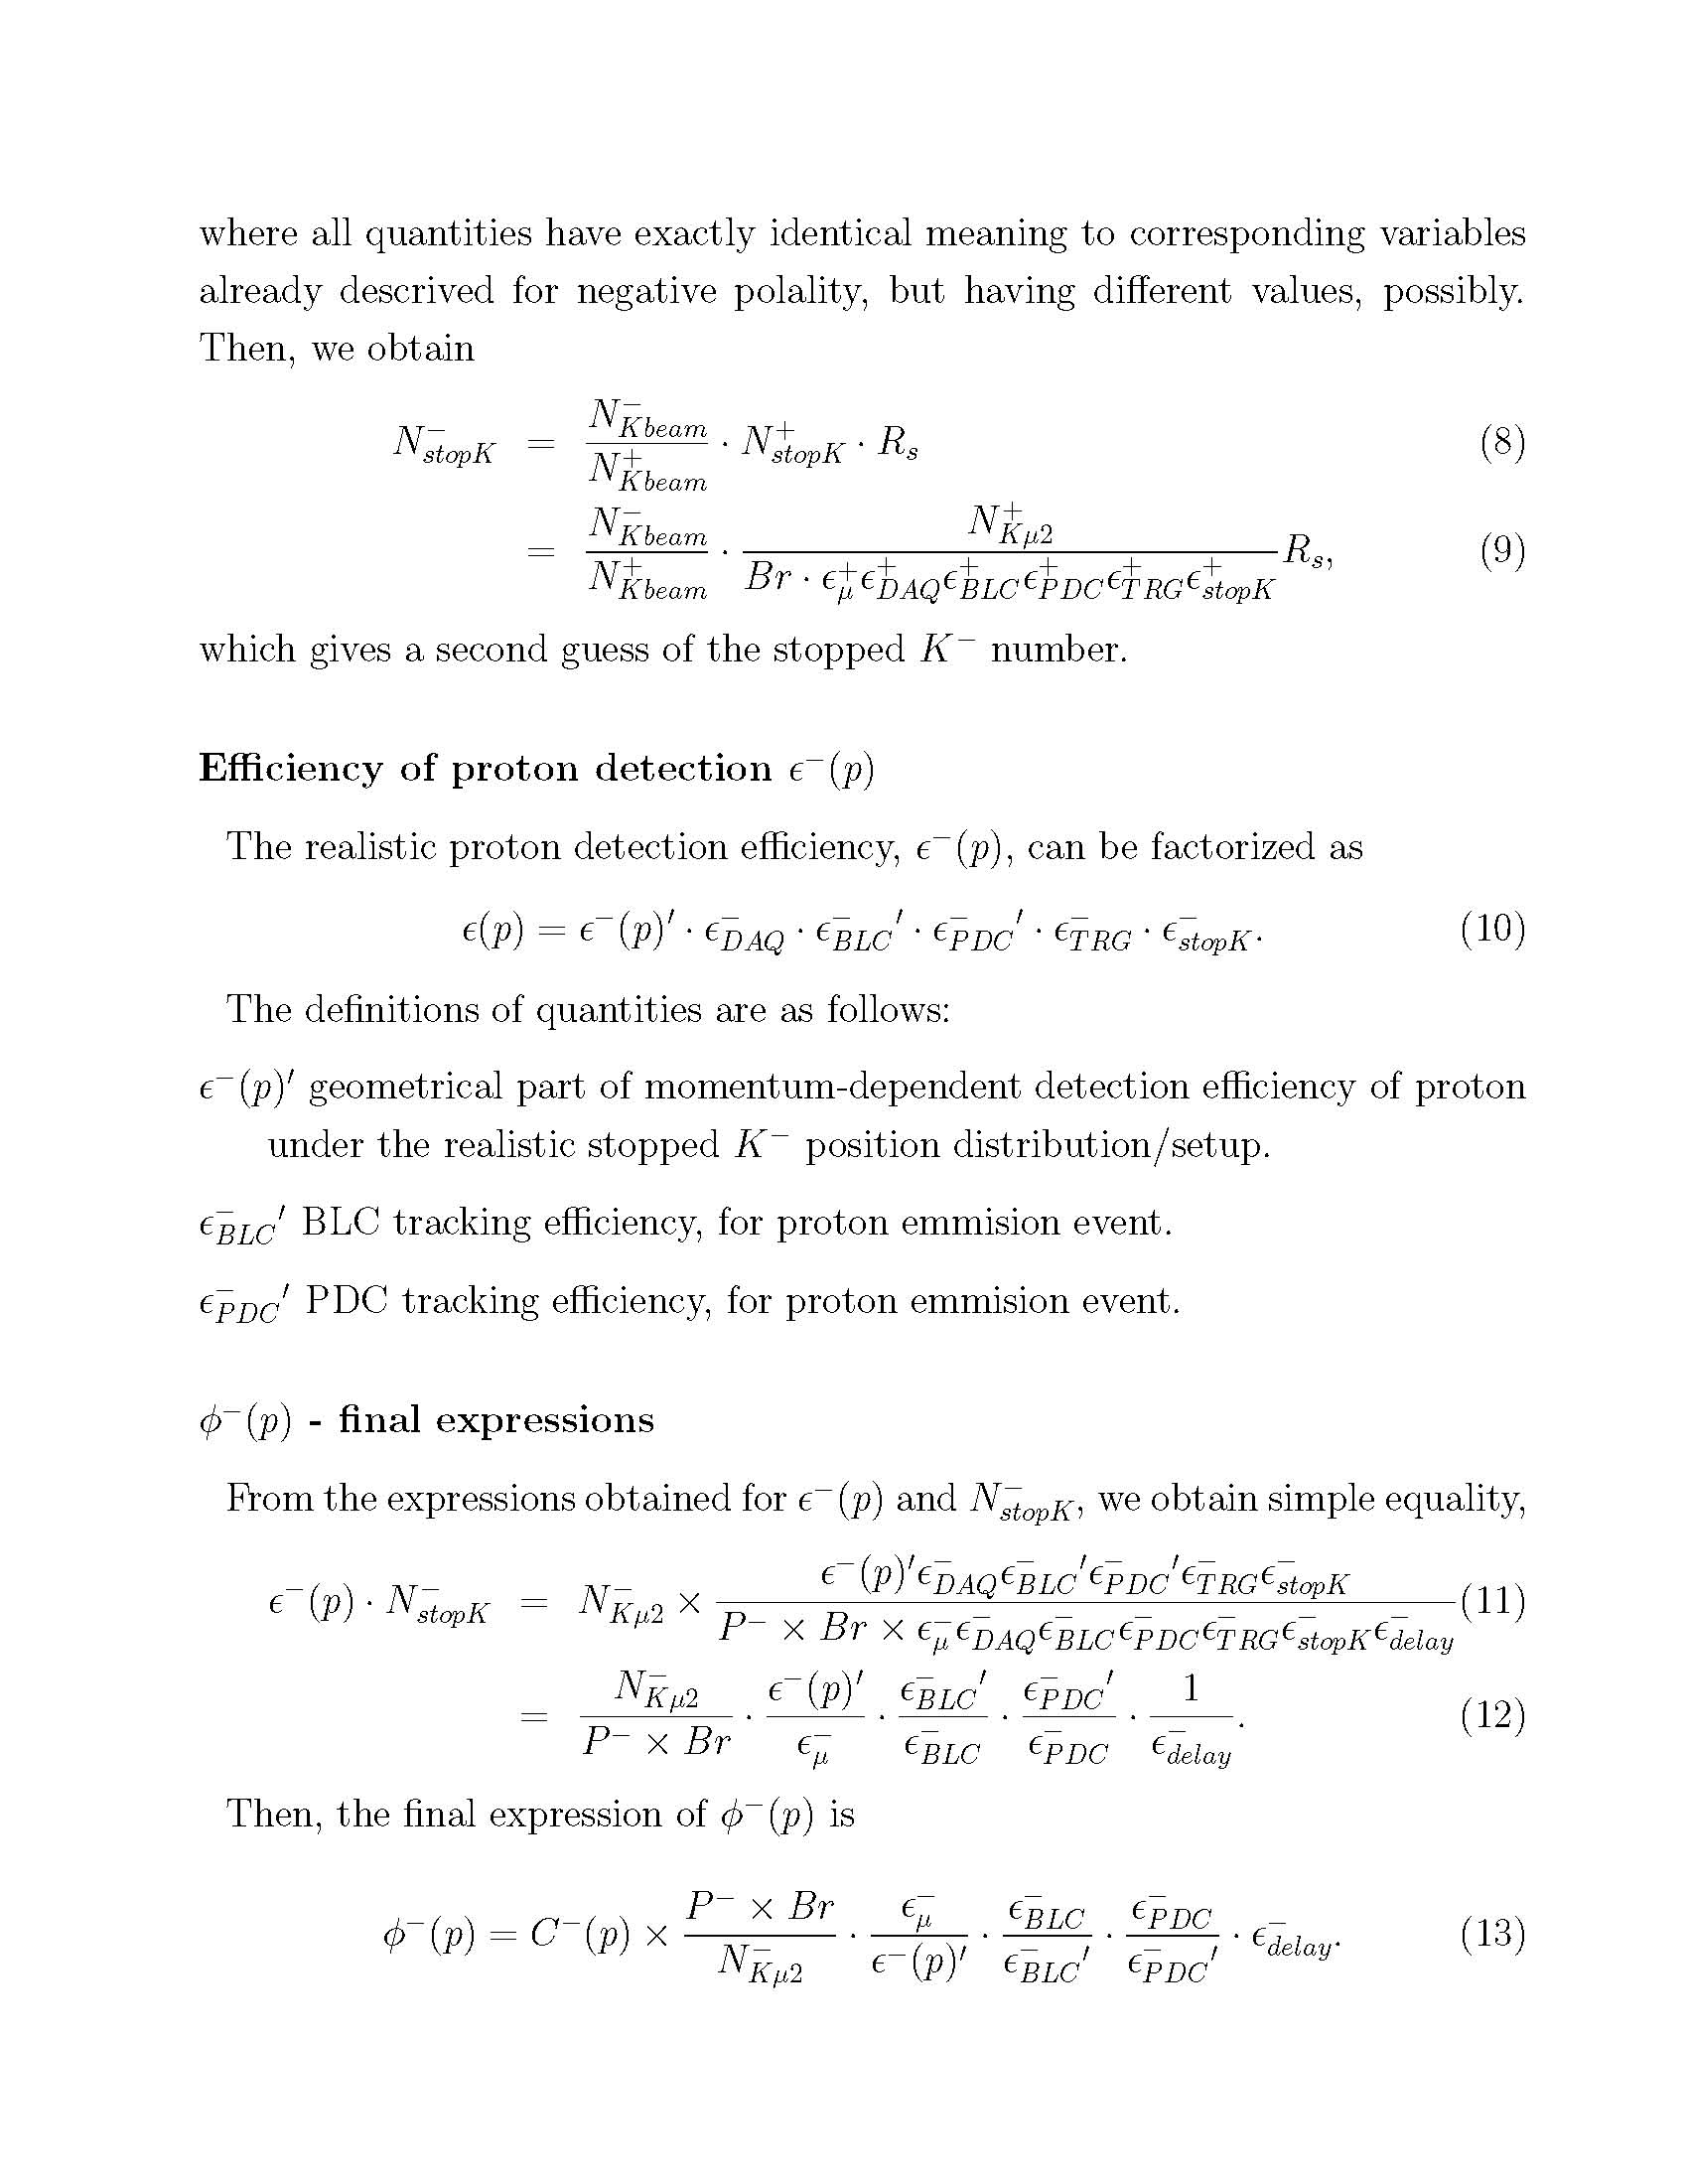
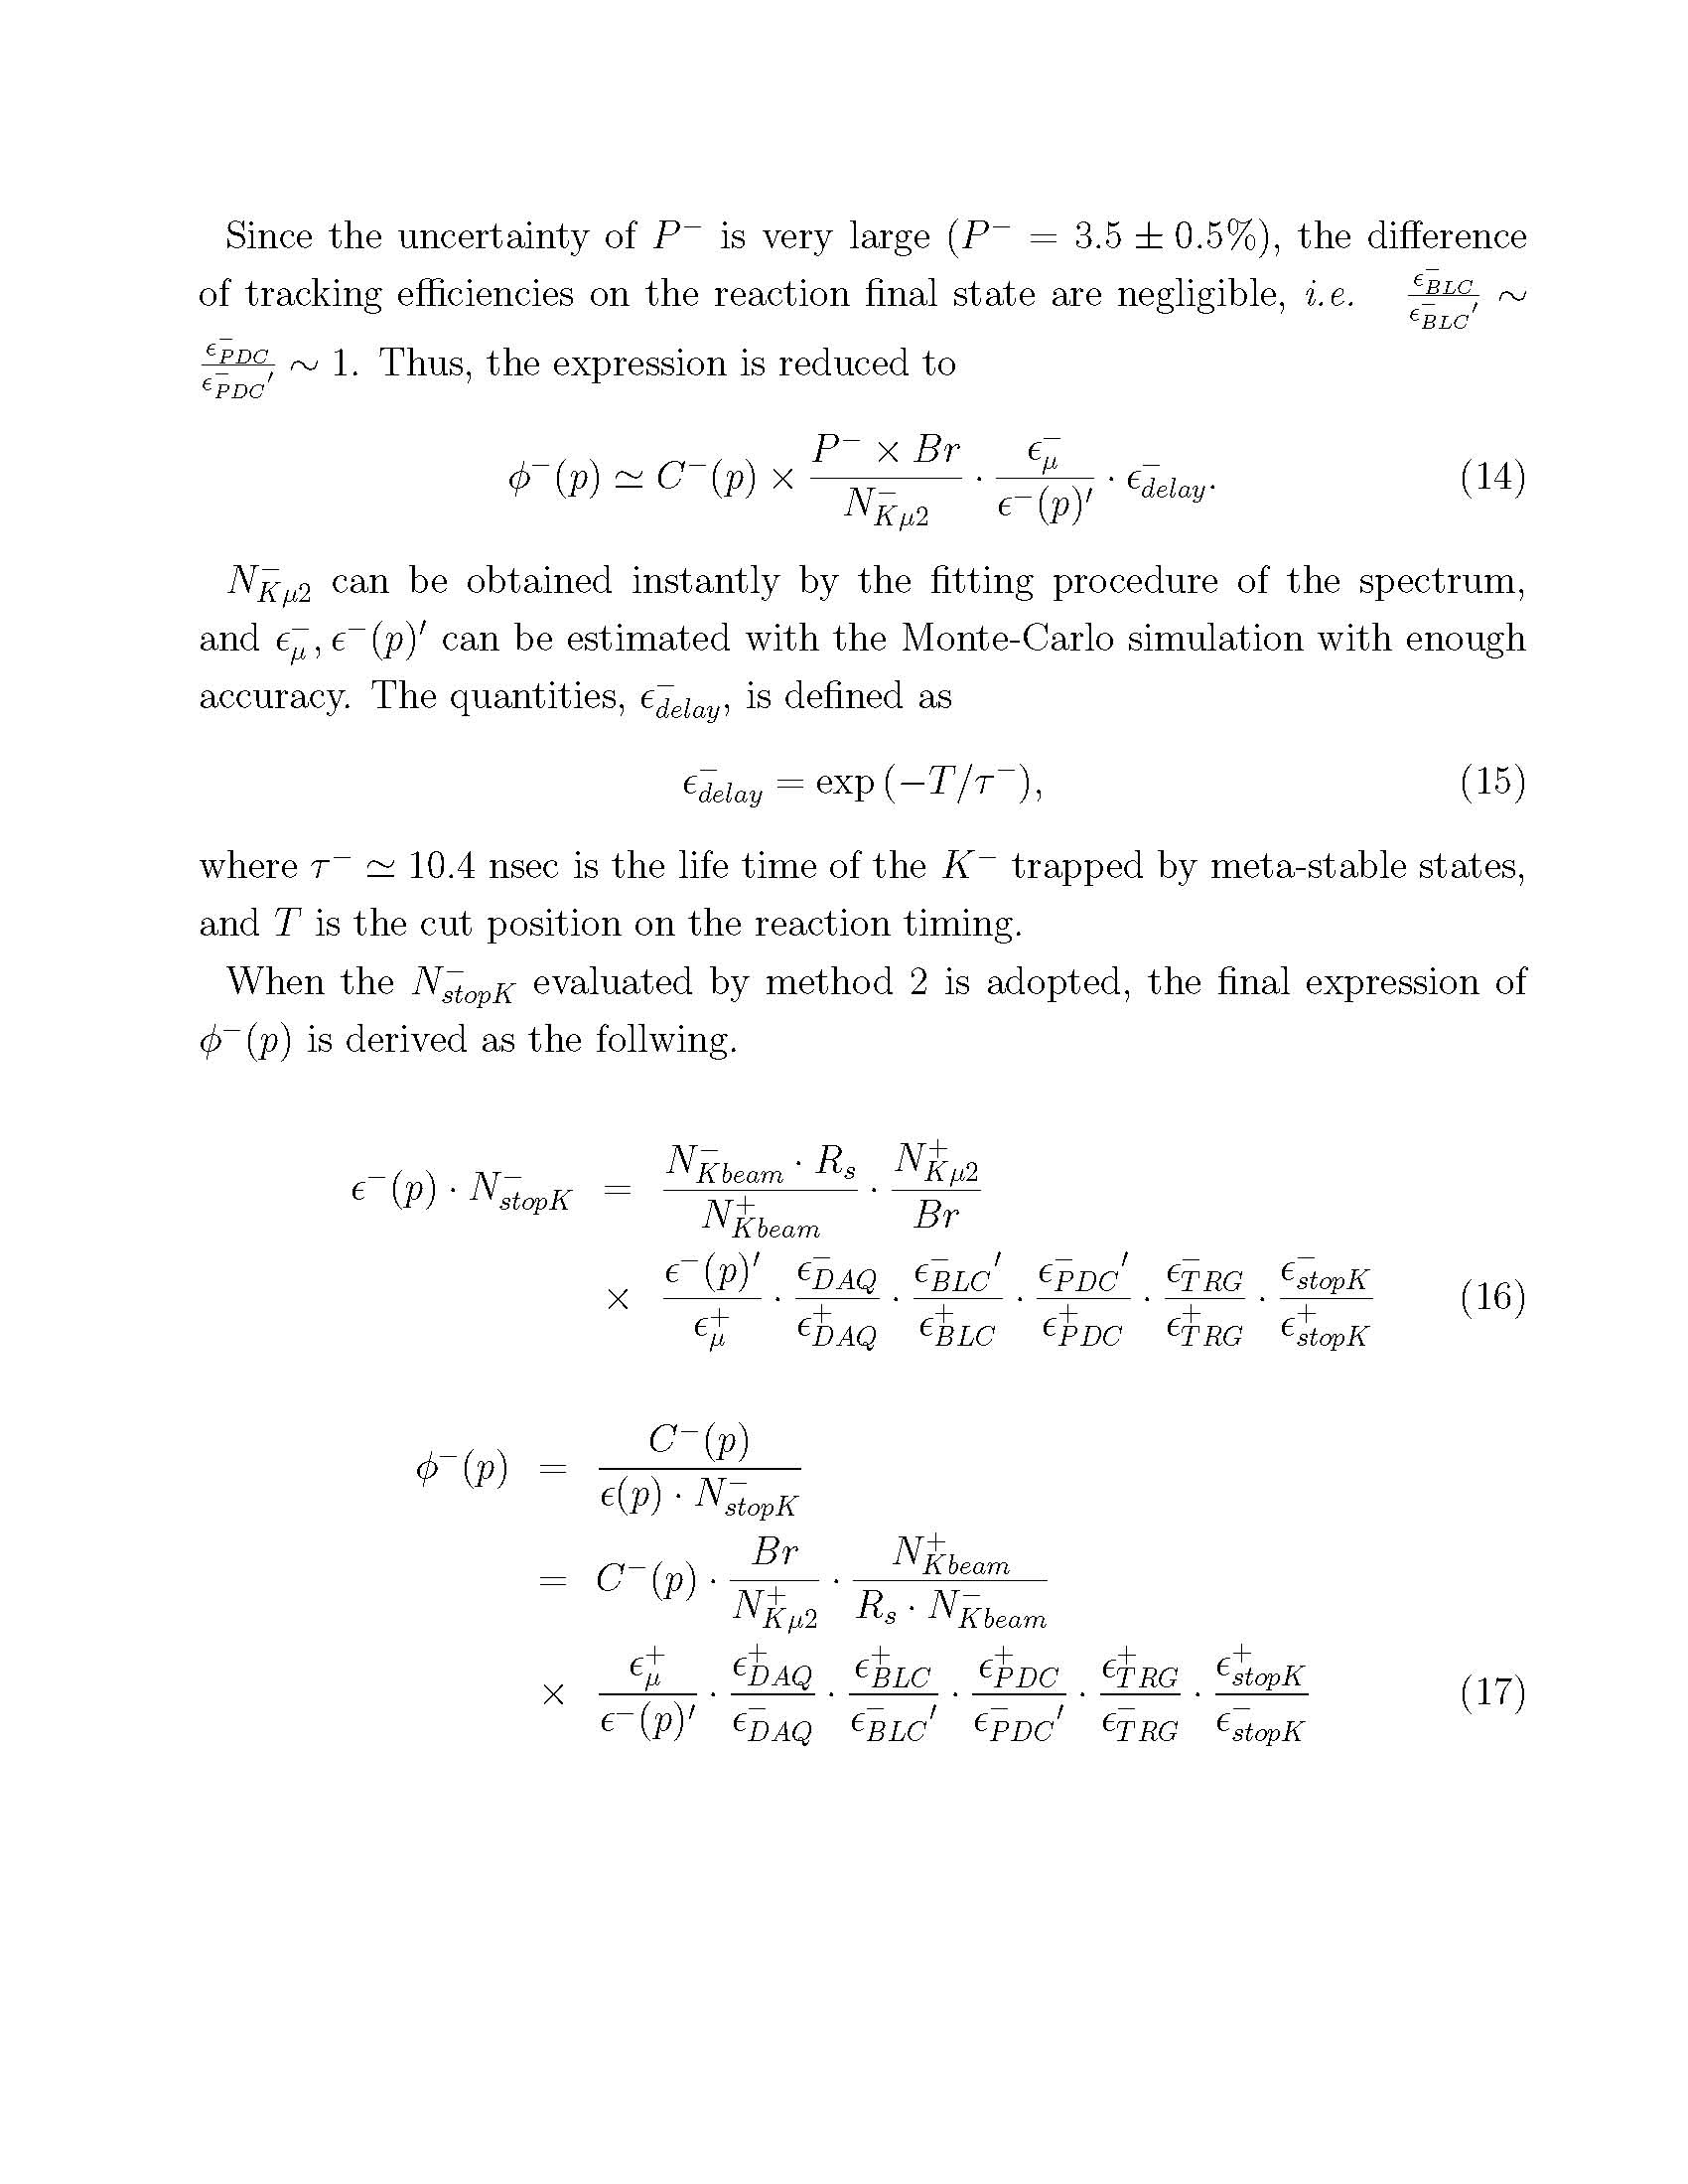
Since the bias from the experimental setup is convoluted in the raw-spectrum, we need to convert it into the physically meaningfull one, 'spectrum of % of stopped K^-'. The discussion about the normalization is as below:
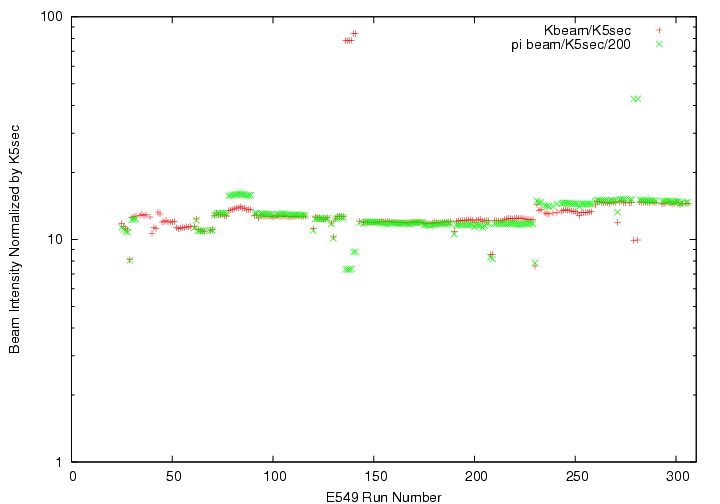
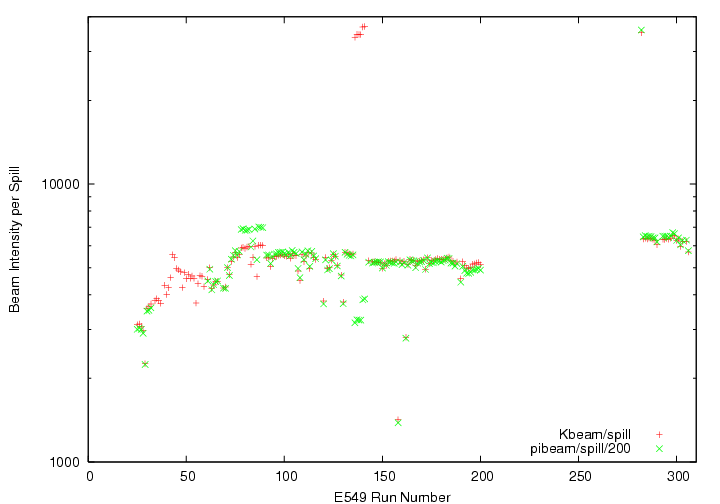
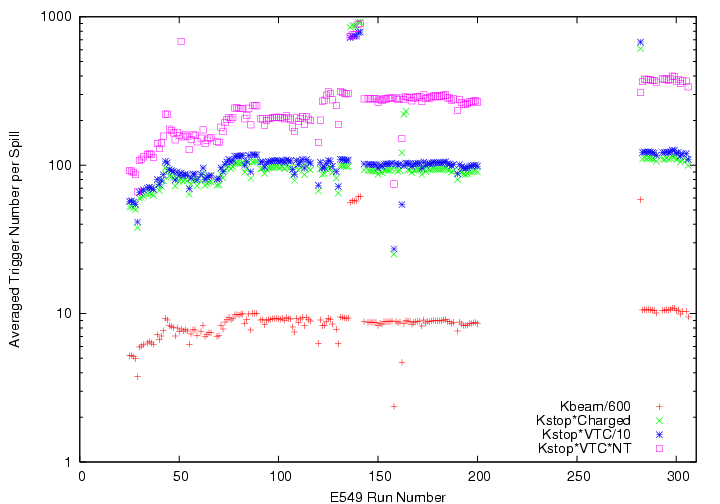
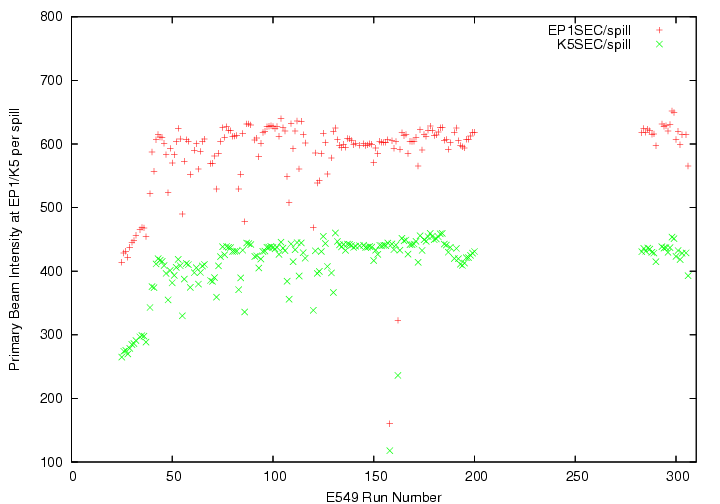
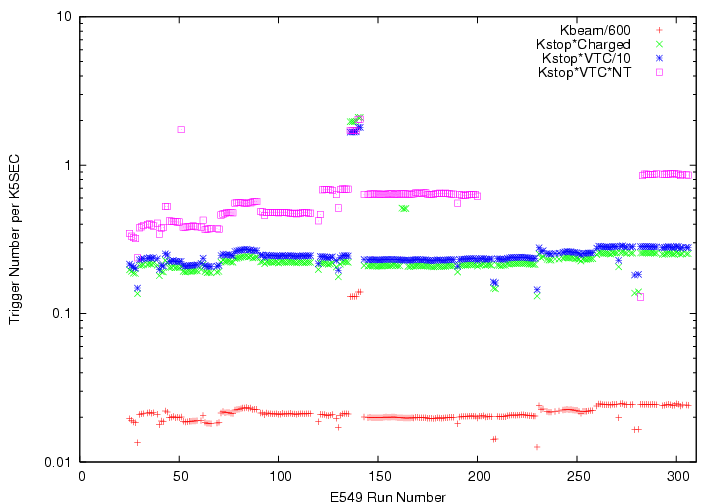
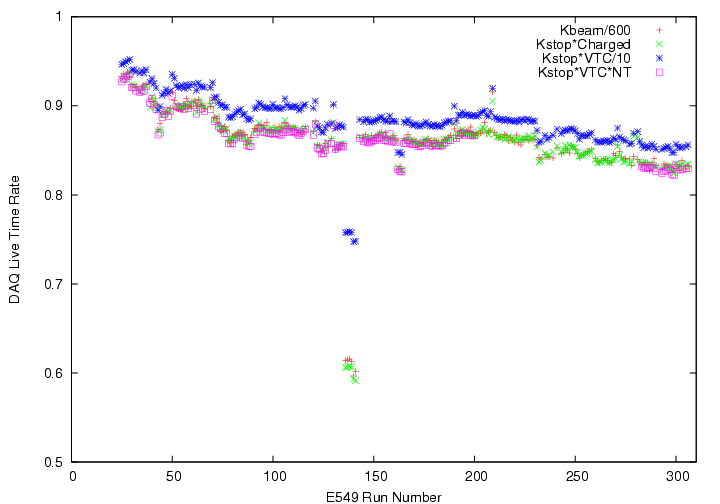
| quantities/polarity | +(run136~141) | -(run25~306) |
|---|---|---|
| DAQ duration (min/hour/day) | 330.4/5.51/0.23 | (17575.7/292.93/12.21) |
| EP1 SEC | 2935034 | 245179544 |
| K5 SEC | 2137044 | 171922841 |
| K5 TM | no data | no data |
| Unbiased trigger number (beam originated) | 8182157 | (98666351)118913208 |
| Accepted trigger number (beam originated) | 5475571 | (85464955)149359182 |
| Overall DAQ live time rate(Accepted/Unbiased) | 66.92 % (cf. E471 45.9%) | (86.62 %) (cf. E471 90.6/91.6 %) |
| K beam counts | 170.1 M (cf. E471 33.9M) | 2177 M (cf. E471 896/806M) |
| Number of accepted/unbiased Kbeam/600 trigger | 0.1730M/0.2835M : 61.02 % | 3.134M/3.629M : 86.36 % |
| Number of accepted/unbiased Kstop-Charged trigger | 2.579M/4.276M : 60.31 % | 32.88M/38.22M : 86.03 % |
| Number of accepted/unbiased Kstop-VTC/10 trigger | 2.752M/3.643M : 75.43 % | 36.99M/41.83M : 88.43 % |
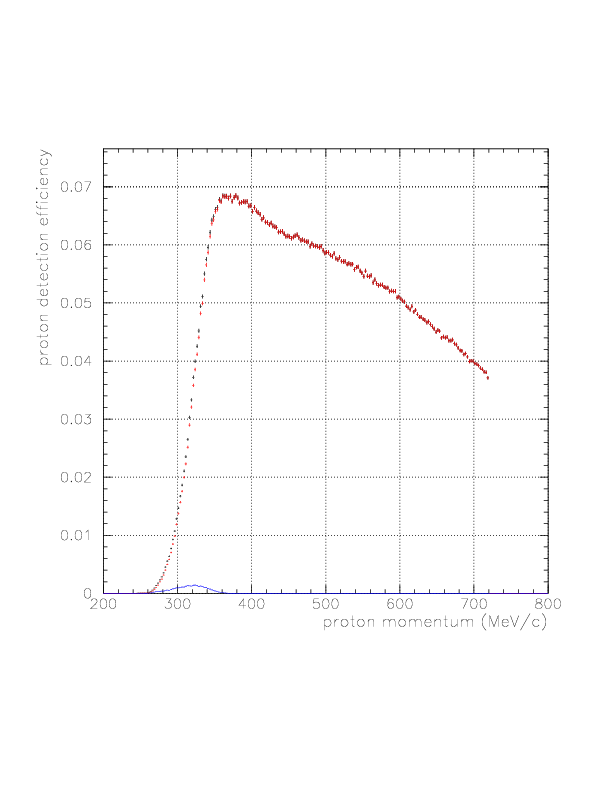
(i) Proton selection procedure with the correlation between 1/beta VS total energy - 1/beta (with 60 + 80 psec timing resolution on PA/PB) and total energy(with infinite resolution, taking the Birk effect into account) are simulated and same analysis procedure is applied.
(ii) Consideration of the PA-PB coincidence gate width - if PA-PB TOF is beyond the gate width, then the proton is discarded. This partly explains the observed disagreement between data and simulated detection efficiency at low momentum region. To check the width, see E549 log book vol.2 p131.
The simulated proton detection efficiency curve, obtained by generating 100,000,000 proton events, is shown below.
Detection efficiency of muon is investigated with 235.53 MeV/c mu^+ with identical setup and position/angle distibutions, and it has been estimated to be 7.55%.
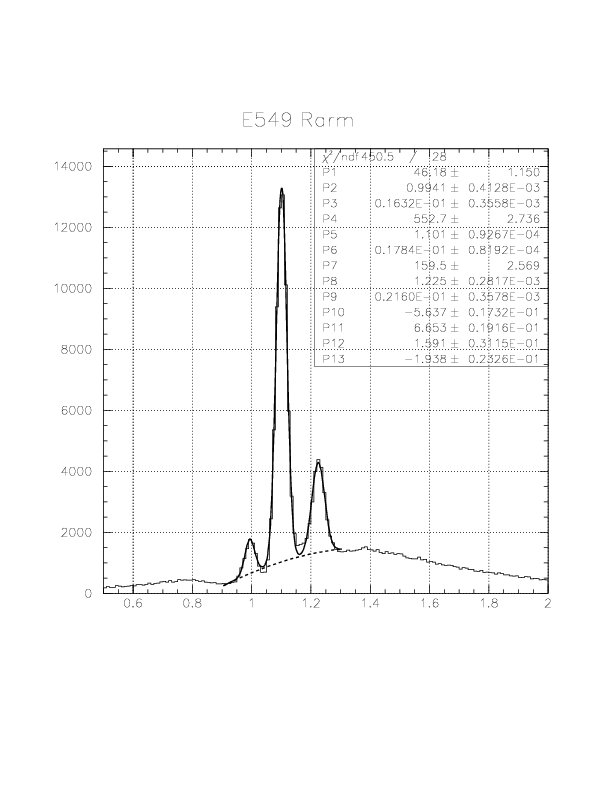
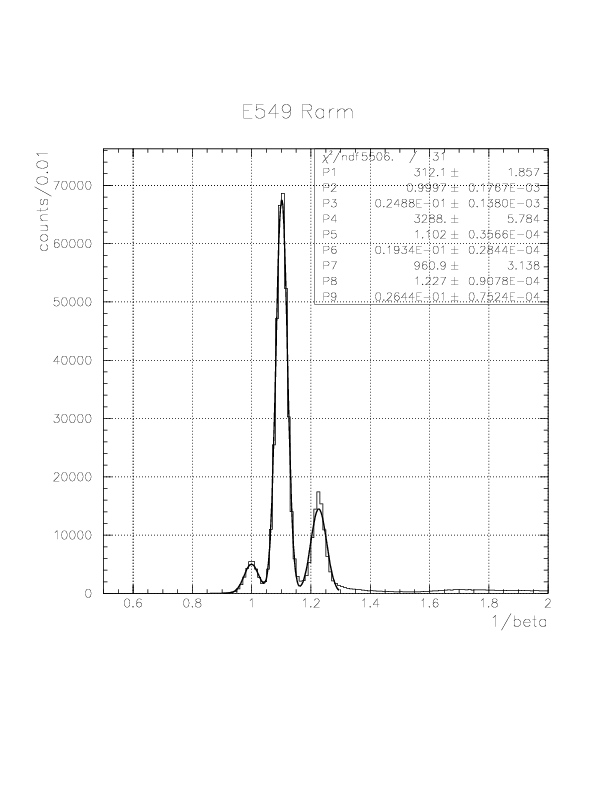
Number of Kmu2 decay is counted by the function fitting procedure to the observed 1/beta spectrum. 3rd order polinomial background and three Gauss functions are adopted as the fitting function. The arm-by-arm fitting result are shown below, and the MINUIT outputs are given here, for L/R arms, and the resulting observed Kmu2 peak numbers are (5.517 +- 0.029)*10^4/(5.527 +- 0.027)*10^4 for L/R arms, with 0.8 nsec delayed-timing-gate condition. Observed Kpi2 peak numbers are (1.74 +- 0.03)*10^4/(1.60 +- 0.03), then.
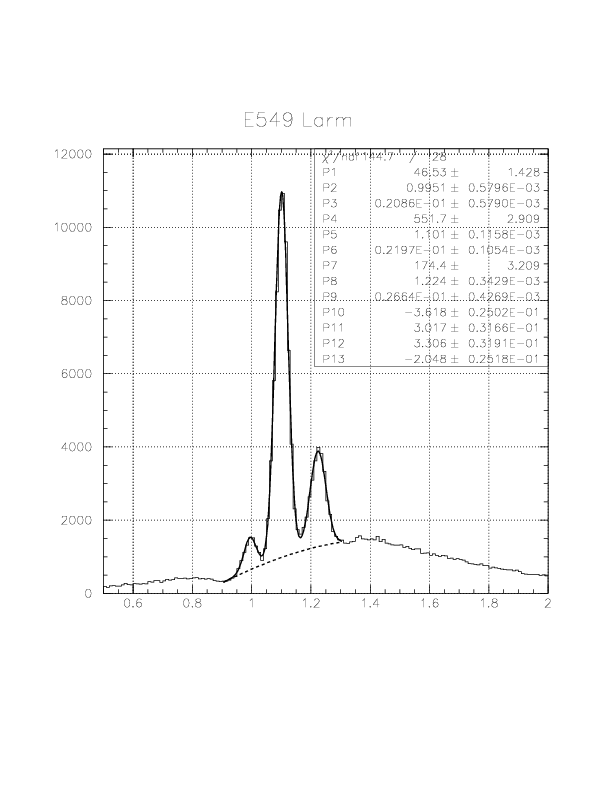
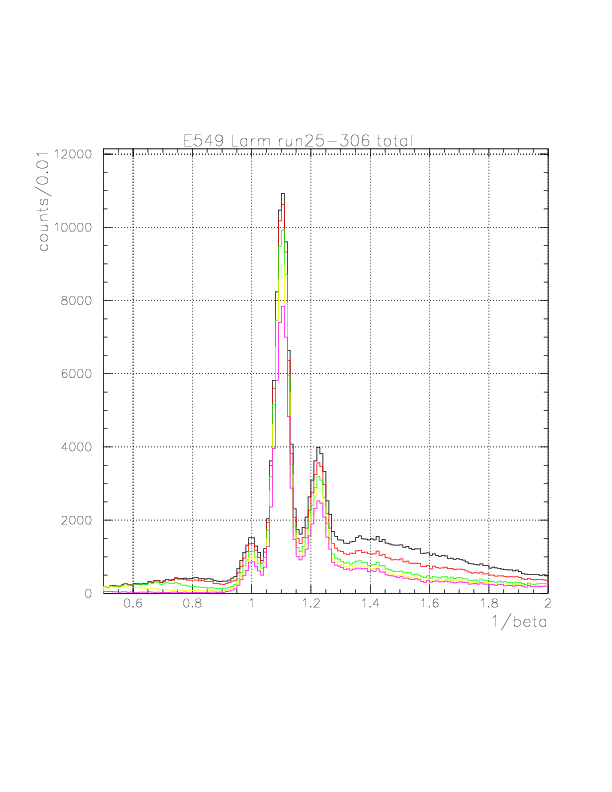
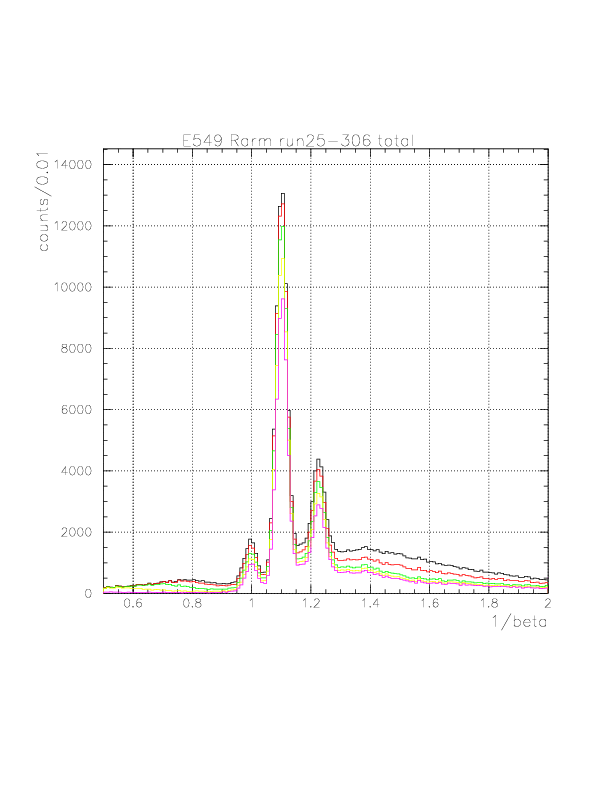
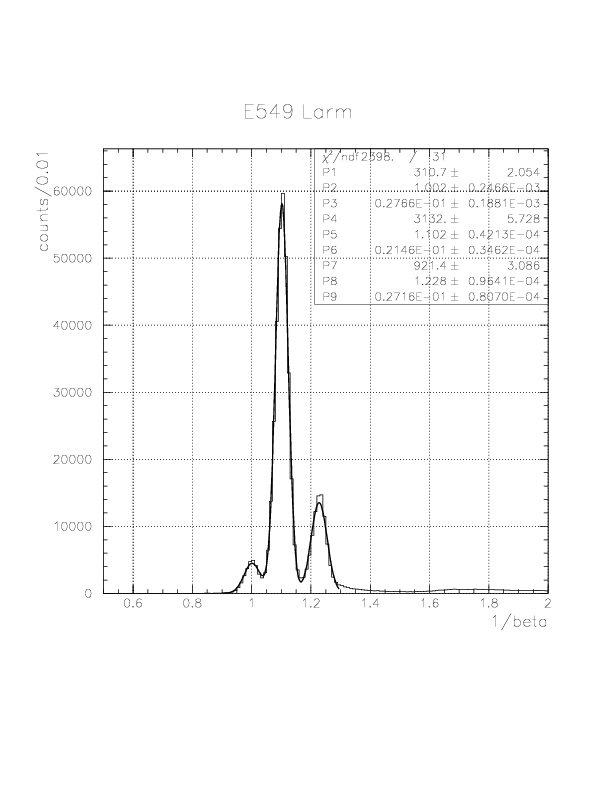
Number of Kmu2 decay is counted by the function fitting procedure to the observed 1/beta spectrum. Since almost no background is expected below Kmu2 peak now, hree Gauss functions are adopted as the fitting function. The arm-by-arm fitting result are shown below, and the MINUIT outputs are given here, for L/R arms, and the resulting observed Kmu2 peak numbers are (3.132 +- 0.006)*10^5/(3.288 +- 0.006)*10^5 for L/R arms. Note that now delayed timing condition is not applied, and stopped K^+ events are selected by Kstop ID function (vertex z VS T0 energy).
N^+_{stopK} = 6.42*10^5/(0.6351*0.0755*0.6031) = 2.22*10^7 ,
N^+_{stopK}/spill = 2.22*10^7/(330.4*(60/4.0)) = 4.48*10^3 ,
N^+_{stopK}/N^+_{beam} = 2.22*10^7/1.70*10^8 = 13.1% (cf. E471 17.3 %),
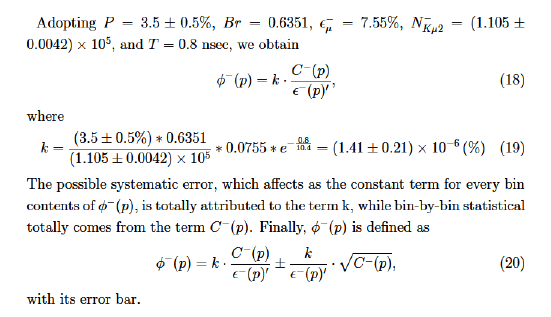
N^-_{stopK} = 1.14*10^5/(0.035*0.6351*0.0755*0.86*exp(-0.8/10.4)) = 8.53 * 10^7 ,
N^-_{stopK}/N^-_{beam} = 8.53*10^7/2.18*10^9 = 3.9% ,
assuming efficiencies of BLC/PDC tracking and Trigger/Kstop selection being 100 % for K^- and K^+, and free decay rate from meta-stable orbit being 3.5% from Dr Outa's thesis. DAQ live time rates were adopted from the table on this page (KstopCharged value).| quantities/polarity | + | - |
|---|---|---|
| central momentum at Q5 exit | 655 MeV/c | 655 MeV/c |
| momentum bite at Q5 exit | +-2% rectangle | +-2% rectangle |
| position/angle distribution at Q5 exit | no | no |
| simulator | LEPS(g77) | LEPS(g77) |
| in-flight decay | on | on(no transport after decay) |
| in-flight reaction | on | on(no transport after elastic/inelastic reaction) |
| energy loss fluctuation | on | on |
| multiple scattering | on | on |
The results are exhibitted below:
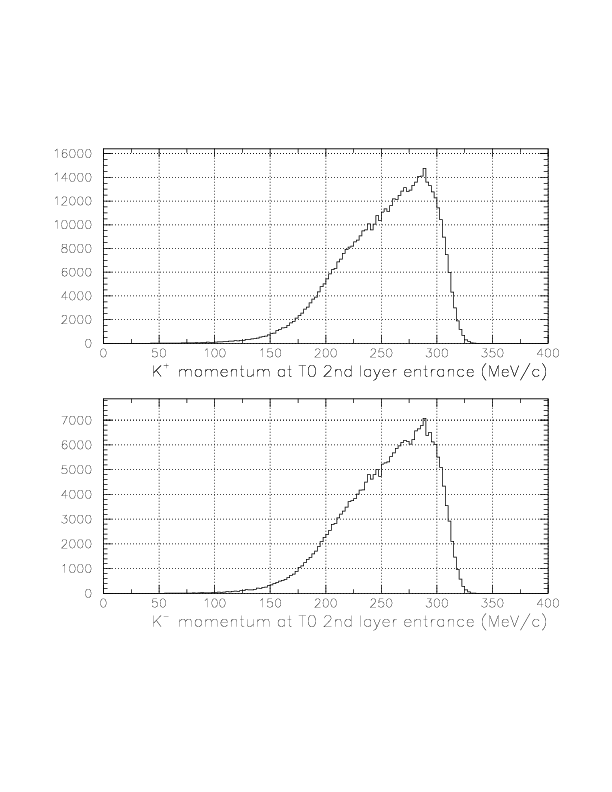
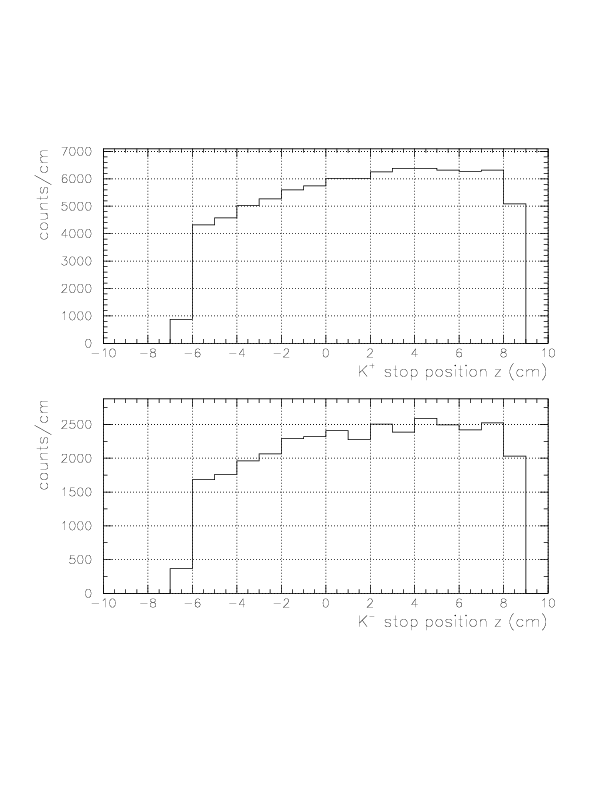
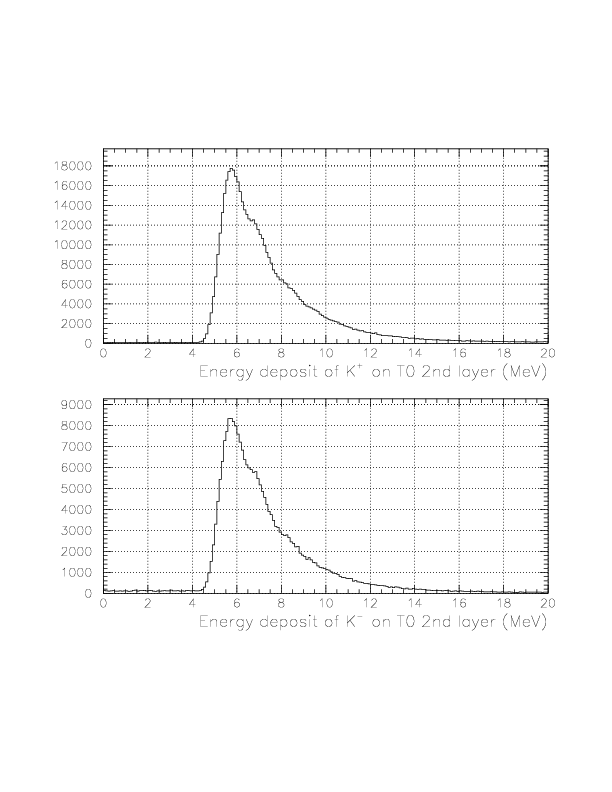
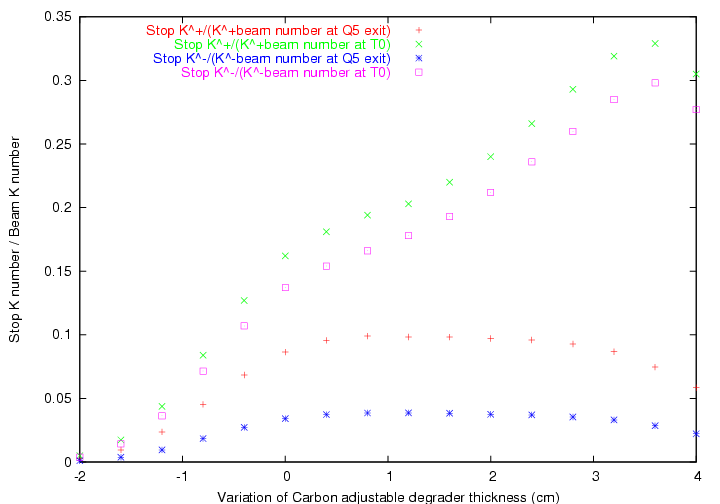
Momentum/range/Energy distributions are almost identical for both cases, and no significanct difference is found. The results if central value of K^- momentum is larger than that of K^+ by 1% are shown below.
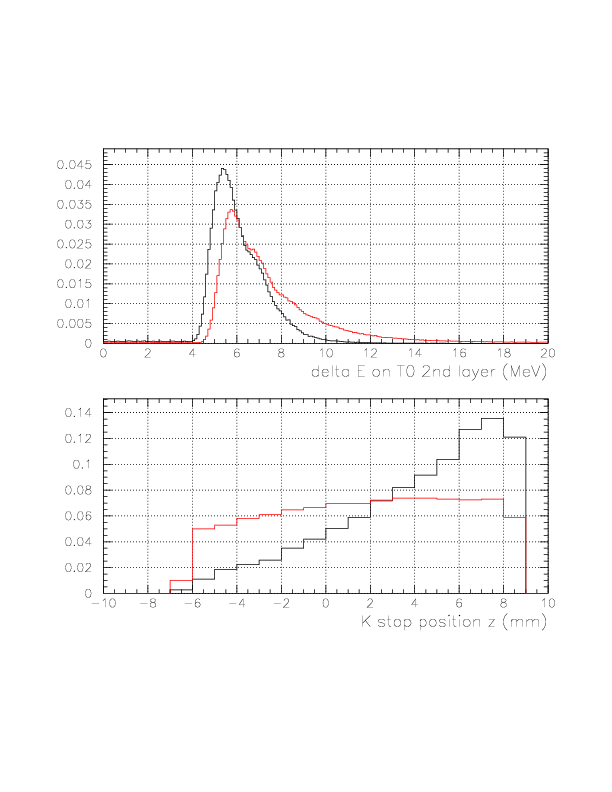
The difference of the energy disdtibution can be explained well, but range distribution is deviated from the observed one, then.
The shift of energy distribution can be reproduced, but range distribution is significantly deviated from the observed ones.
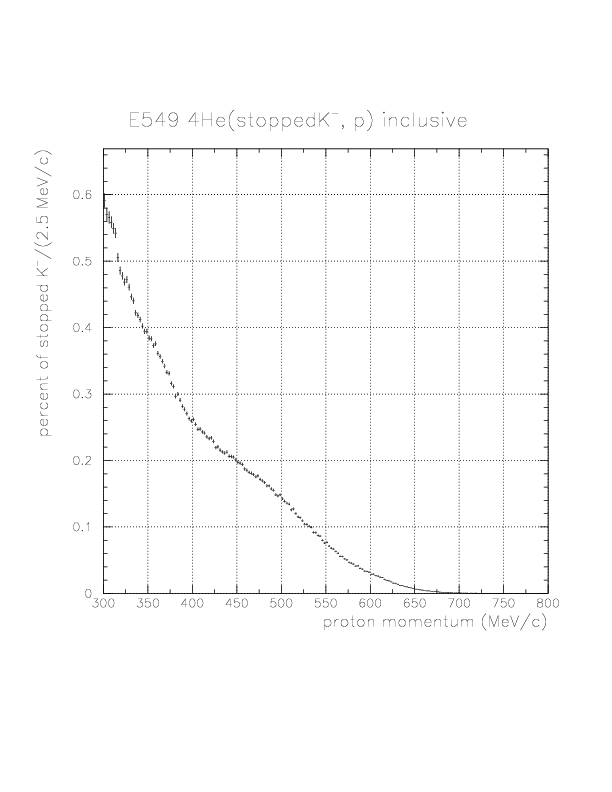
| Momentum Region (MeV/c) | Integrated Area (% per stopped K^-) |
|---|---|
| 300~400 | 16.03 |
| 400~500 | 7.98 |
| 500~600 | 3.19 |
| 600~700 | 0.41 |