Since we do not know the relative position of chambers with required accuracy, we do need to investigate the possible position offset values from their nominal ones. For the E549 experiment, they are studied by some calibration runs as tabulatted below.
| Run | Trigger | VDCtop(y-x/y-z) | VDCbottom(y-x/y-z) | BLC(z-x/z-y) | PDC L(x-y/x-z) | PDC R(x-y/x-z) | Purpose |
|---|---|---|---|---|---|---|---|
| 304 | pi^-*VTC | 324.1/365.1 | 255.1/323.6 | 223.5/225.8 | 226.1/249.0 | 201.2/254.0 | BLC-VDC |
| 292 | pi^-*PA*PB | 341.7/343.5 | 266.8/300.5 | 205.6/202.7 | 159.5/161.4 | 148.3/155.6 | BLC-PDC L/R |
| 117,118,119 | VTCcosmic | 219.0/234.3 | 177.7/200.6 | - | - | - | VDCtop - VDCbottom |
| 238,239,240,241,242 | VTCcosmic | 220.8/230.8 | 182.0/202.7 | - | - | - | VDCtop - VDCbottom |
| 136(137,138,139,140,141) | K^+*PA*PB / K^+*VTC | 278.2/295.9 | 219.7/251.2 | 119.5/116.5 | 153.6/154.0 | 144.3/147.5 | BLC-PDC L/R / BLC-VDC |
1. VDCbottom position study. VDCbottom position with respect to VDCtop is studied. The study is performed with cosmic ray data. The detailed procedure is described here(note that definition of variables had been modified from the definition there...). The results is tabulatted below:
| Run | Delta x (mm) | Delta y (mm) | Delta z (mm) | psi (mrad) (around x axis) | theta (mrad) (around y axis) | phi (mrad) (around z axis) |
|---|---|---|---|---|---|---|
| Adopted values | 0.75 | 0.60 | 4.03 | -4.3 | 5.9 | 0.5 |
| 117~119 | 0.77 | 0.70 | 4.00 | -5.1 | 5.5 | 1.3 |
| 238~242 | 0.75 | 0.60 | 4.03 | -4.3 | 5.9 | 0.5 |
The agreement of these two results is satisfactory, hence the result from run 152~154 represents all, and used all over the first cycle.
2. BLC position study. BLC position is studied with respect to the VDCtop/bottom (note that now VDC position is accurately known). The study is performed with both of K~ + -VTC and pi - VTC triggered data. The detail is described here.
| Run | Delta x (mm) | Delta y (mm) | Delta z (mm) | psi (mrad) (around x axis) | theta (mrad) (around y axis) | phi (mrad) (around z axis) |
|---|---|---|---|---|---|---|
| adopted values | 4.1 | 0.0 | 39.9 | 12.4 | 12.7 | 5.0 |
| 136 | 0.07/-0.03 | 0.2/0.3 | 40.3/41.1 | 13.3/6.0 | 14.6/12.9 | 6.2/3.7 |
| 304 | -0.07/0.02 | 0.0/-0.3 | 38.8/38.2 | 14.4/12.2 | 17.7/12.7 | 5.5/4.9 |
3. PDC position study. PDC position is studied with respect to BLC. The study is performed with pi^-*PA*PB triggered data. The detail is described here, but it should be noted that adopted data set is switched from K^+*PA*PB (E549) to K^+*PAPB+pi^+-*PA*PB (E570) to confirm the robstness of the positionning study. The parameter delta z and theta is very difficlut to be determined... hence, theta + delta z is directly determined with respect to VDC, with the events in which VDC and PDC have detected simultaneous tracks.
| Run | Delta x (mm) L/R | Delta y (mm) L/R | Delta z (mm) L/R | psi (mrad) (around x axis) L/R | theta (mrad) (around y axis) L/R | phi (mrad) (around z axis) L/R |
|---|---|---|---|---|---|---|
| adopted values | 1.5/-2.2 | 1.8/0.4 | 8.0/4.0 | 6.4/0.6 | 10.8/4.2 | -5.8/3.2 |
| 136 | 1.9/-2.4 | -0.04/-0.01 | 0.03/0.00 | 6.6/0.4 | 10.8/4.8 | -5.9/4.4 |
| 292 | 1.2/-1.9 | 0.00/0.03 | 0.04/0.03 | 6.2/0.8 | 10.8/3.3 | -5.8/2.1 |
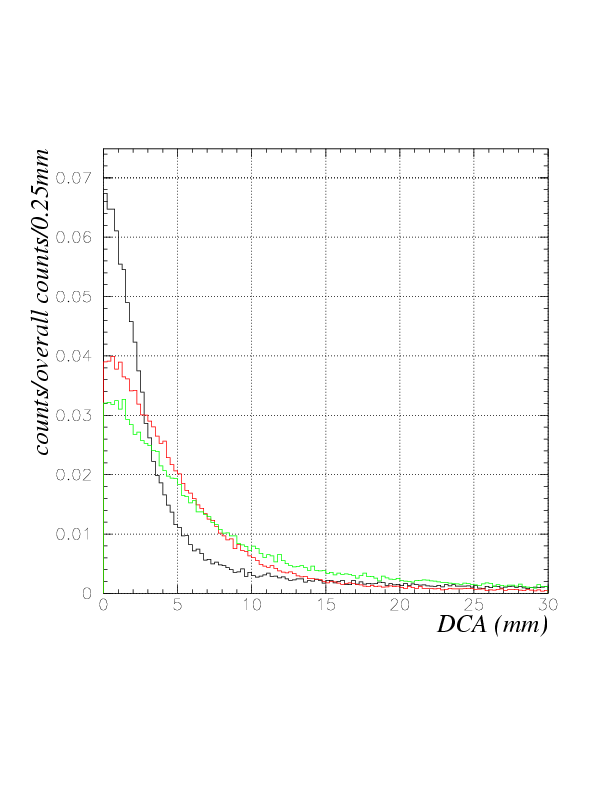
Comparison of BLC-VDC DCA distribution for pi^--VTC (black), K^+-VTC(red) and K^--VTC(green) is shown below. Fiducial volume cut is applied without stop K selection.
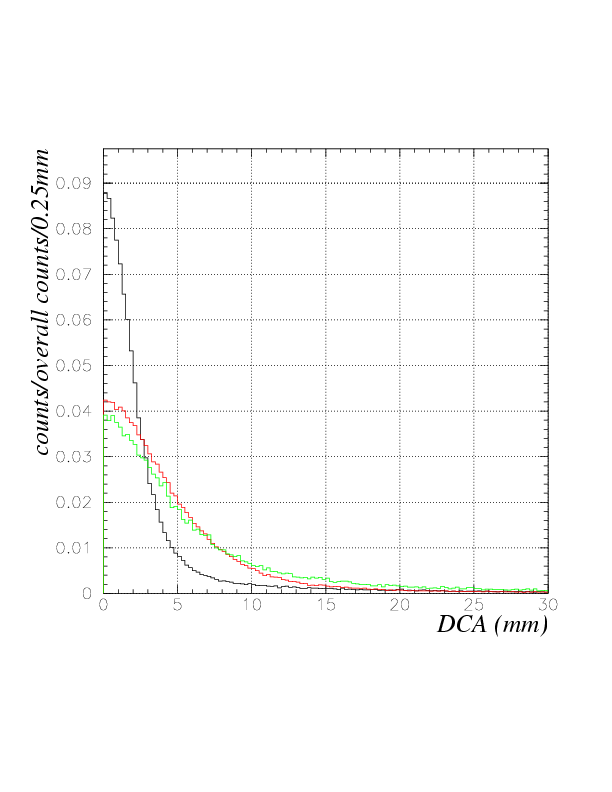
Comparison of BLC-PDC DCA distribution for pi^--PAPB (black), K^+-PAPB(red) and K^--PAPB(green) is shown below. Fiducial volume cut is applied without stop K selection.
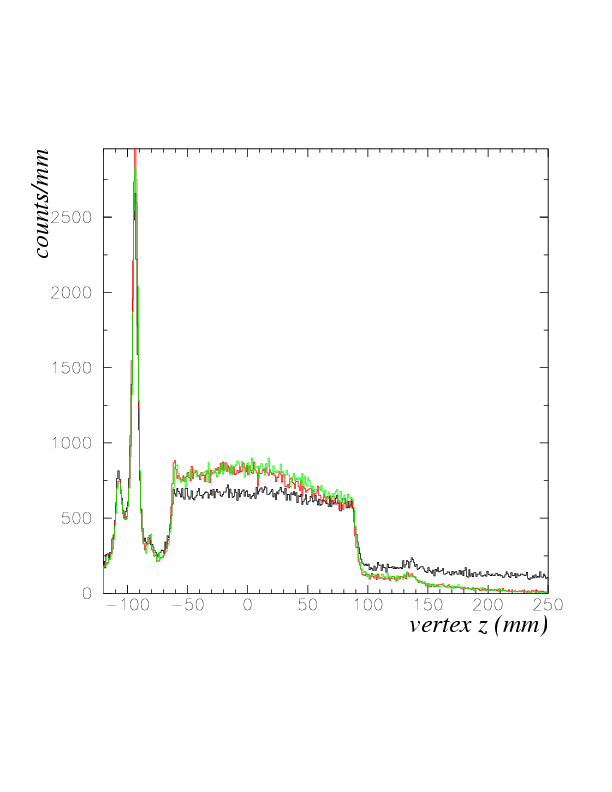
A comparison of BLC-VDC (black) and BLC-PDC L(red)/R(green) z-vertex distribution for K^+ run is shown below. Since PDC L/R z-position has been completely studied, all 3 shows a reasonable agreement. Note that they agree with only after PDC L/R z-position is carefully studied. Otherwise, they disagree by 5mm order.