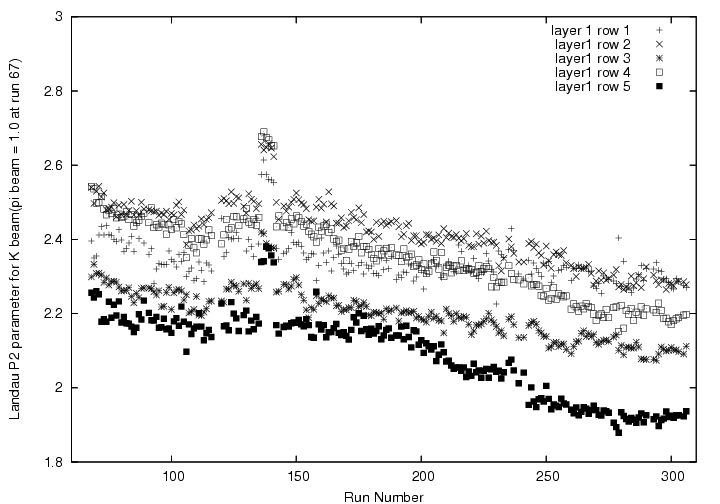
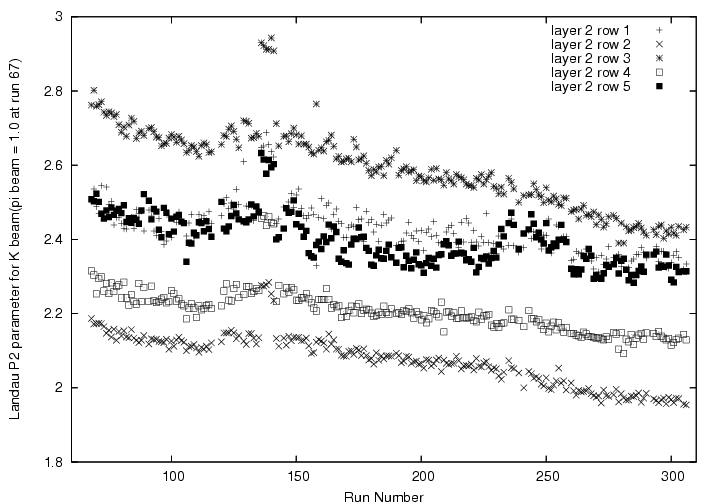
In order to study the stability of T0 gain, K beam trigger data is avalilable. After pion dE/dx peak is adjusted to be 1.0 for all T0 segments by run 67, kaon peak position under K beam trigger is studied. The resulting run-by-run stability is shown below segment-by-segment. Generally, T0 gain gradually decrease, and the deviation can be 15~20 %. Hence, T0 gain should be corrected run-by-run and segment-by-segment, in order to introduce the stopped K selection by an unified (i.e. run-independent, segment-independent) way. It is also seen that kaon peak position is strongly segement-dependent, which implies the segment-dependent non-linearity of pulse height, as already pointed out. After the introduction of tentative(segment-dependent) stoppeed K selection, we will solve this non-lienarity. Unfortunately, T0 gain jumps for K^+ - which implies the incident beam intensity dependence of the gain (tipiclly, 1.0(4cm)-1.4(6cm) M for negative polality, while 700(4cm)-800(6cm) k for positive). Therefore, it is fairly difficult to introdce stopped K selection available for both polality. This variation is not used directly and uniformly - i.e. it will be applied after non-linearity is resolved by dE-dependent way.
We can introduce stop K selection by using a correlation between T0 light output VS Z-vertex. However, PMT-dependent non-linearity, run-by-run fluctuation and rate dependence of PMT introduce a certain difficulty to define it by run-segment-independent way, as demonstrated below. Even if we adjust PMT gain by pion beam and gain variation is negligible from the original run, PMT-dependent nonlinearity deforms the proper correlation between vertex z vs detected energy deposit on the 2nd layer of T0. At this moment, we define tentative cuts PMT-by-PMT for local runs(say, run 100->104), for which PMT gain are assumed to be stable from the preceding gain study.
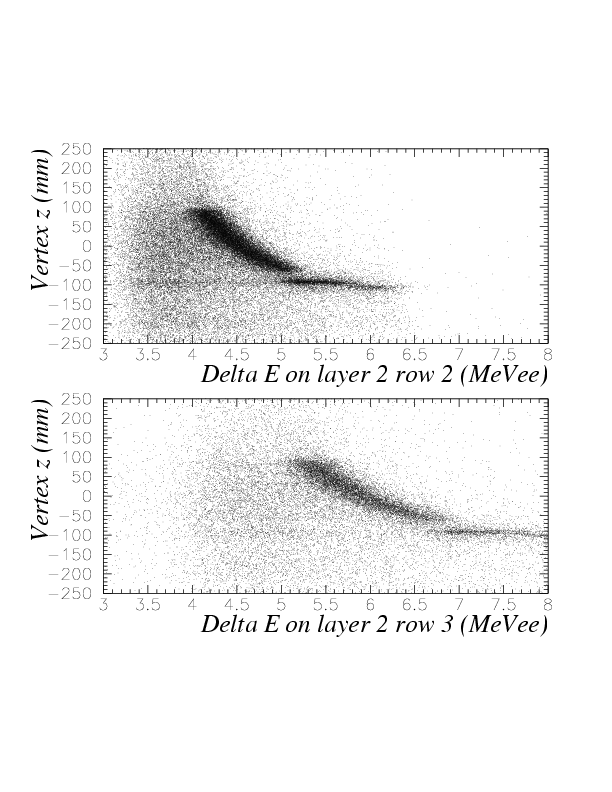
When this tantitave cut is introduced, we can study the non-linearity of each PMT by the deviation between expected dE/dx from stopped position in the target, and detected one.
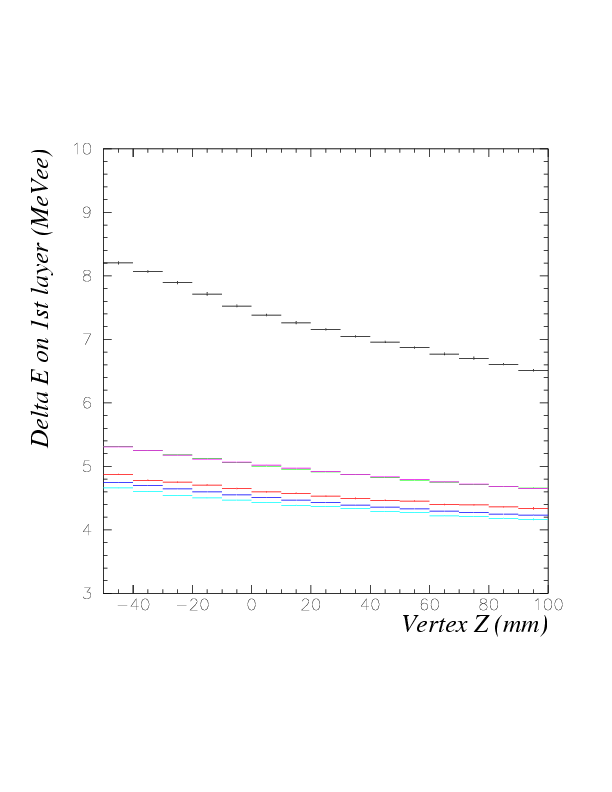
The observed PMT-dependent non-linearity is shown below, by the comparison between the simulated correlation between vertex z vs T0 effective light output. Black:simulated, red, green, blue, magenta, sky-blue: detected for row 1, 2, 3, 4, 5 of layer 1(top) or 2(bottom), respectively.
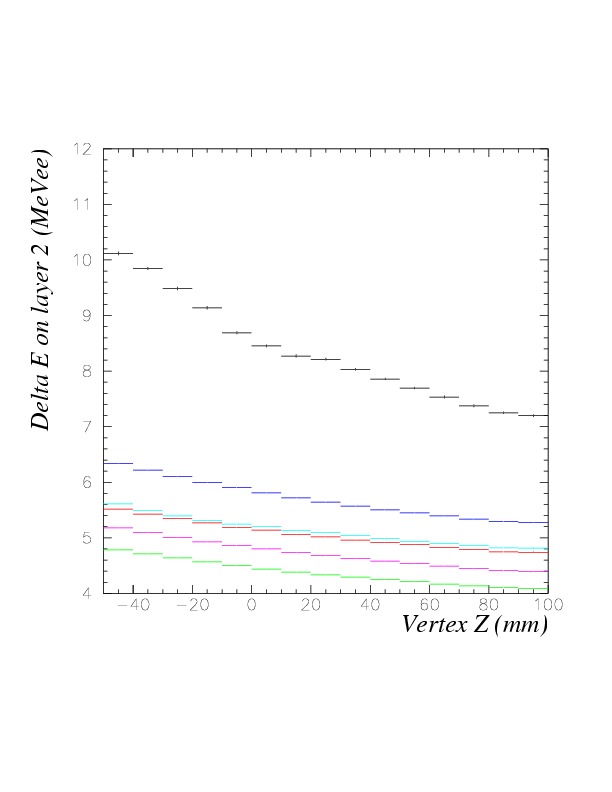
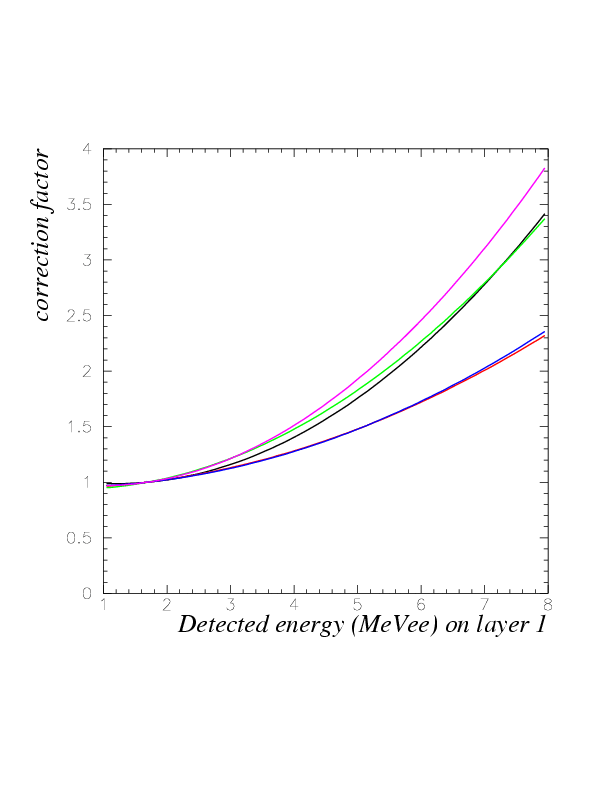
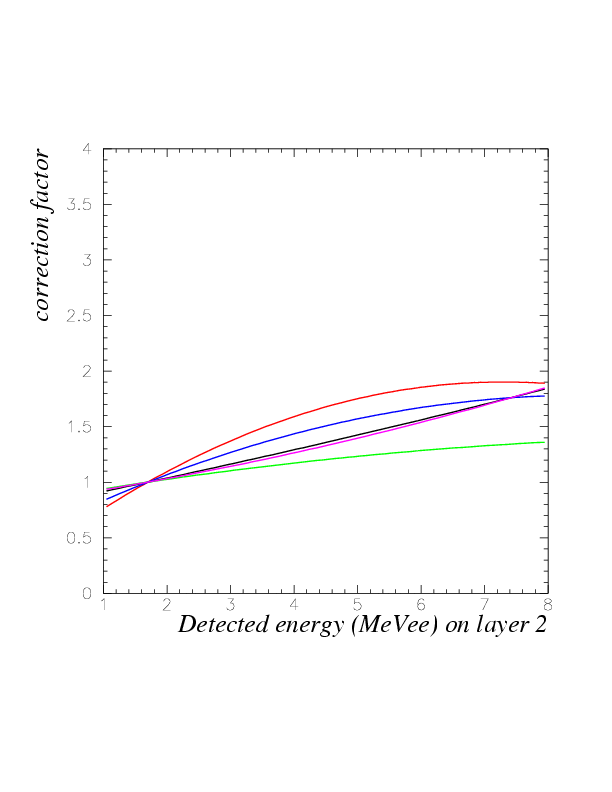
From above comparison, we can determine row-by-row energy-correction function, as the function of detected energy, by fitting the expected detection energy divided by detected energy with a second order polinomial, fixing the function value to 1.0 at 1.7MeVee for MIP, which is the referential point of gain tune. Blcak, red, green, blue, and magenta:correction function for row 1,2,3,4, and 5, for layer 1(top) and 2(bottom), respectively.
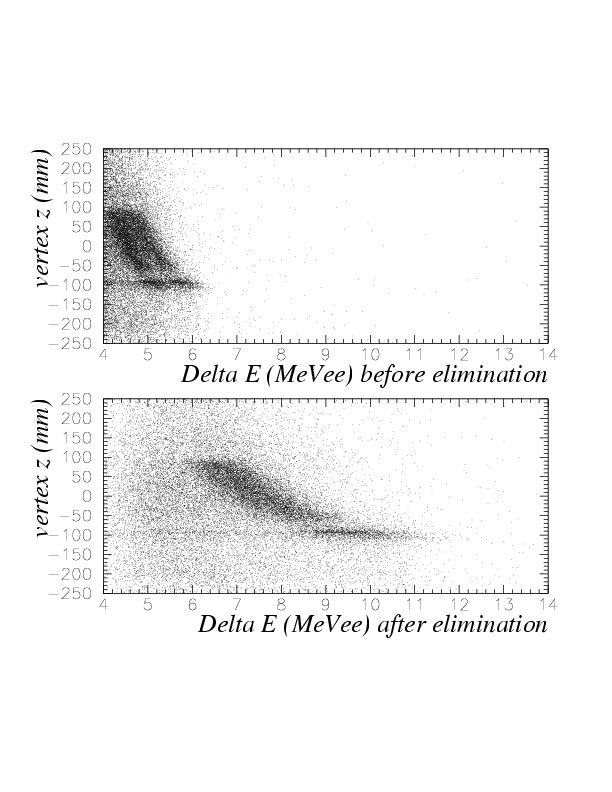
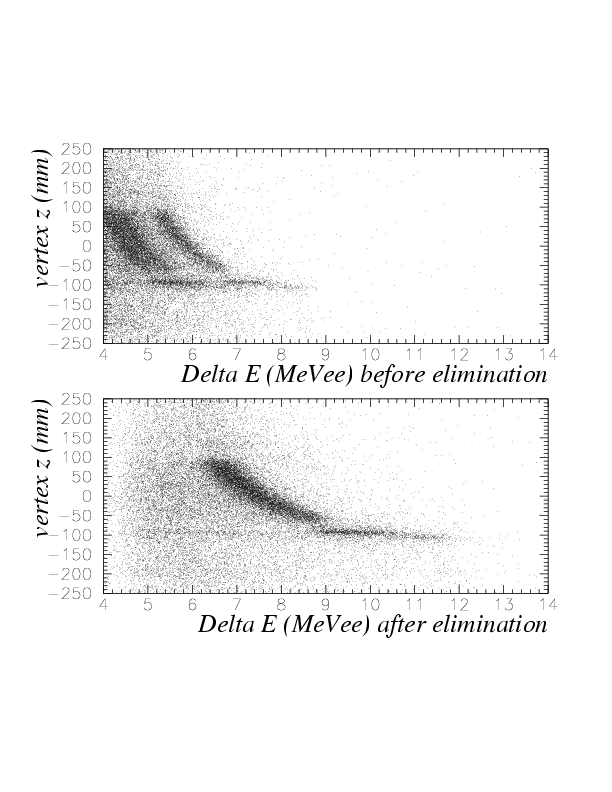
After the solution of the non-linearity, the correlation between detected energy on T0 and vertex z becomes row-independent. Below, correlation between vertex z and T0 light output is compared for both 1st and 2nd layers before(top) and after(bottom) the elimination of non-linearity, for run 108. A dependence of the bundle position on T0 row ID is complately eliminated. Hence, we have been able to introduce the final stopped K^- selection by an unified way, at this stage.
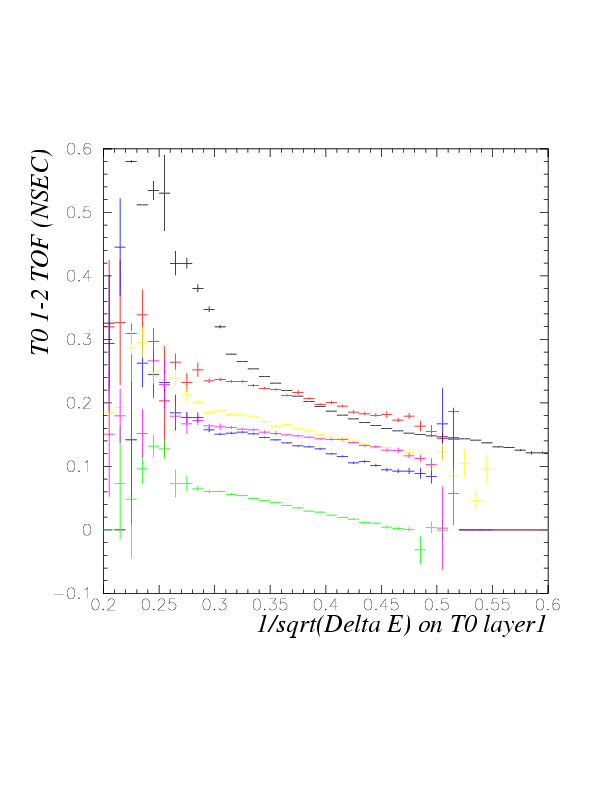
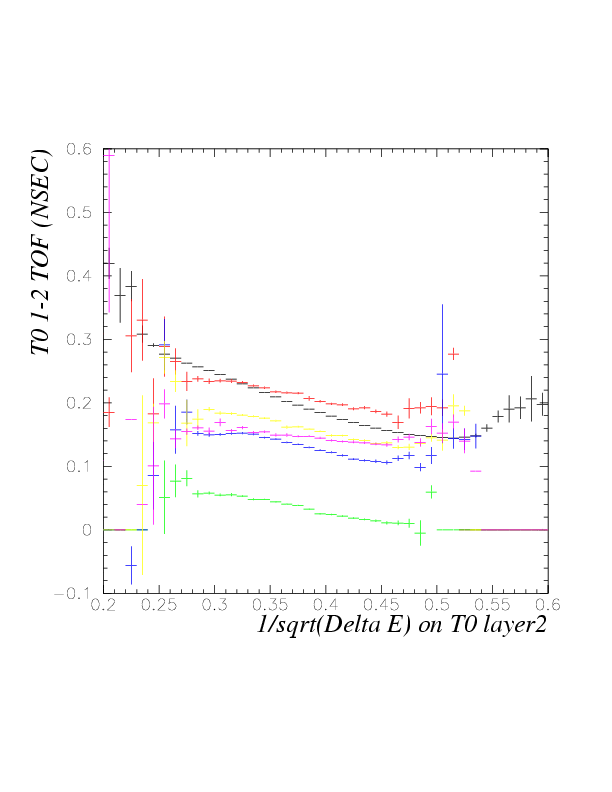
Since non-linearity has been eliminated and detected energy loss is precisely determined, now we can compare 2-1 time difference vs detected energy with the expected ones, row-by-row, hence, investigate the validity of slewing parameters obtained. Now, the correlation after the elimination of nonlinearity of the detected energy is shown below, for 1st(top) and 2nd(bottom) layers. The row-by-row agreement is now satisfactory. Black: simulated, red:row 1, green:row 2, blue:row 3, yellow:row 4, magent:row 5. The observed small deviation can be attributed to the trigger bias of the data.
Since we have defined stopped K selection, and Kstop-VTC trigger data exists, now it is possible to estimate stopped K^- number per spill, almost directly. For the run 100, 101, and 102, the total DAQ duration is 284 minutes, in which 4260 beam spill are included. Detected stopped kaon number is 2.68*10^4 so that 2.68*10^4/4260=6.3 stopped kaons are obserbed per spill. If we multiply 10, and 5, which are prescale factor and VDC effective solid angle, respectively, then we obtain 50*6.3 This number should be increased by 20~30 %, because fast charged particle emission probability and DAQ dead time are assumed to be 1.0 here, although they should be ~0.9 and 0.8~0.9, respectively.
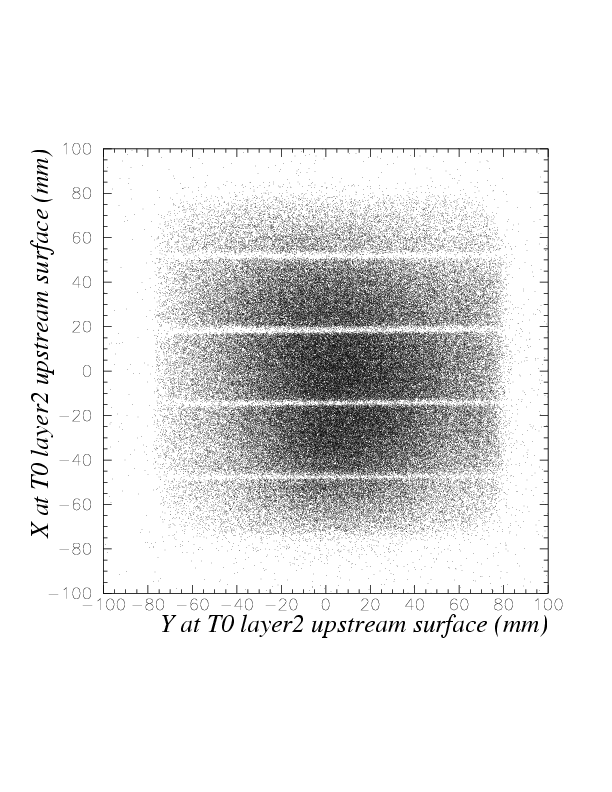
T0-BLC consistency is defined, by the agreement of PMT R - L time difference and x section at z-position of T0 upstream-surface horizontally, and by fired row ID and y section there, respectively, with 2nd layer. The x-y profile at T0 2nd layer upstream surface is shown below for run 67 (pi beam)- exhibitting T0 inefficient region. From expected and detected row ID's for down-stream layer, we introduce T0-BLC y-consistency .
As well-known, the time difference is linearly correlated to the hit position. The 2-dimensional correlation between R-L time-difference and blc x section is exhibitted below, with its profile. After fitting the profile by linear function, light velocity in T0 is known to be 11.8-12.6 cm/nsec, and time diff - position conversion function is obtained row-by-row.
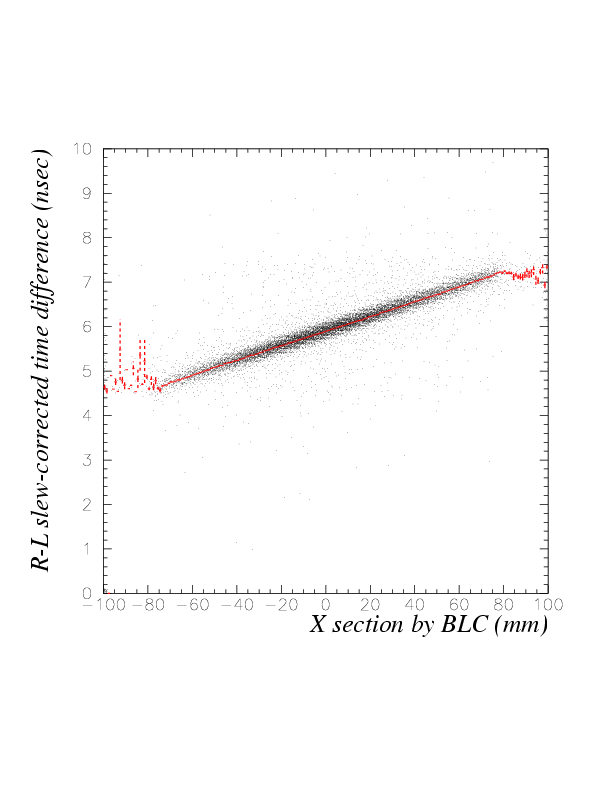
x-consistency is defined by the scale of the difference between blc-detected x position and the position expected from the time-difference. For pion, position resolution by L-R time difference is 6~7 mm, and the events in which the deviation are within \pm 3 sigma are judged as the consistent events.